Whether you’re running a personal home page or a major corporate website, Google Analytics is a powerful tool for monitoring your traffic. It doesn’t matter if your site gets one or a million impressions per month — Google will record what every single visitor gets up to, helping you to understand and improve their experience. See also: Choosing your web hosting package.
Jump to:
- How to use Google Analytics: What can it tell me?
- How to use Google Analytics: Acquisition
- How to use Google Analytics: Behaviour
- How to use Google Analytics: Real-time
- How to use Google Analytics: Summary
Indeed, I use Google Analytics on the PC Pro website, to gain a real-time overview of how the site is performing, and examine the performance of individual pages and sections of the site.
If you’re new to online analytics then the Google Analytics interface can seem daunting. But as we reveal below, you only need to learn a few simple techniques to start working out what is or isn’t working on your website. Visit: The easy way to sell ad space on your website.
You’ll then be able to turn cold data into valuable information, which when applied to future website decisions, can boost your online performance significantly.
How to use Google Analytics: Why?
There are lots of different web analytics providers out there. Some, like Adobe’s SiteCatalyst, charge a steep fee for the service. Others offer only basic software for free, in the hope you’ll upgrade to a paid-for service at a later date.
Google Analytics is free
Google Analytics, however, is a completely free service — at least, until you reach around 10 million hits per month. Frankly, if you have those figures, the $150,000 annual fee for the premium service shouldn’t be a problem. For the rest of us, getting set up is a very simple process that can be done in a matter of minutes.
The only real downside to Google Analytics is that it’s not the most intuitive service to use. Once you familiarise yourself with the front-end, however, you’ll have access to an ocean of data that, when used properly, can effectively write your next six months’ web strategy for you.
Legacy data
One advantage to Google Analytics is the fact that there’s virtually no limit to how much legacy data you can store, so you can analyse how your site has grown and evolved over time. Here at PC Pro, we have analytics data going back to 24 June 2008 — with a few clicks, we can confirm that the top article on the site that day was “Murdoch fumes as Facebook overtakes MySpace”, with 4,173 views. (Needless to say, our online presence has grown since then.)
While historical statistics can be revealing, analytics can also provide extremely valuable insights through real-time data. Here, Chartbeat is a good alternative to Google Analytics, offering easier access to in-depth data and a friendlier interface.
How to use Google Analytics: What can the data tell me?
Google Analytics reports information in four key areas: it can tell you about your audience (how many people visited your site), acquisition (how they got to your site), behaviour (what they did while they were on your site) and real-time activity (what’s happening on your site right now).
Navigating Google Analytics
Tip: The navigation bar on the left side of the web page is how you can access all the different sections of Google Analytics data mentioned above.
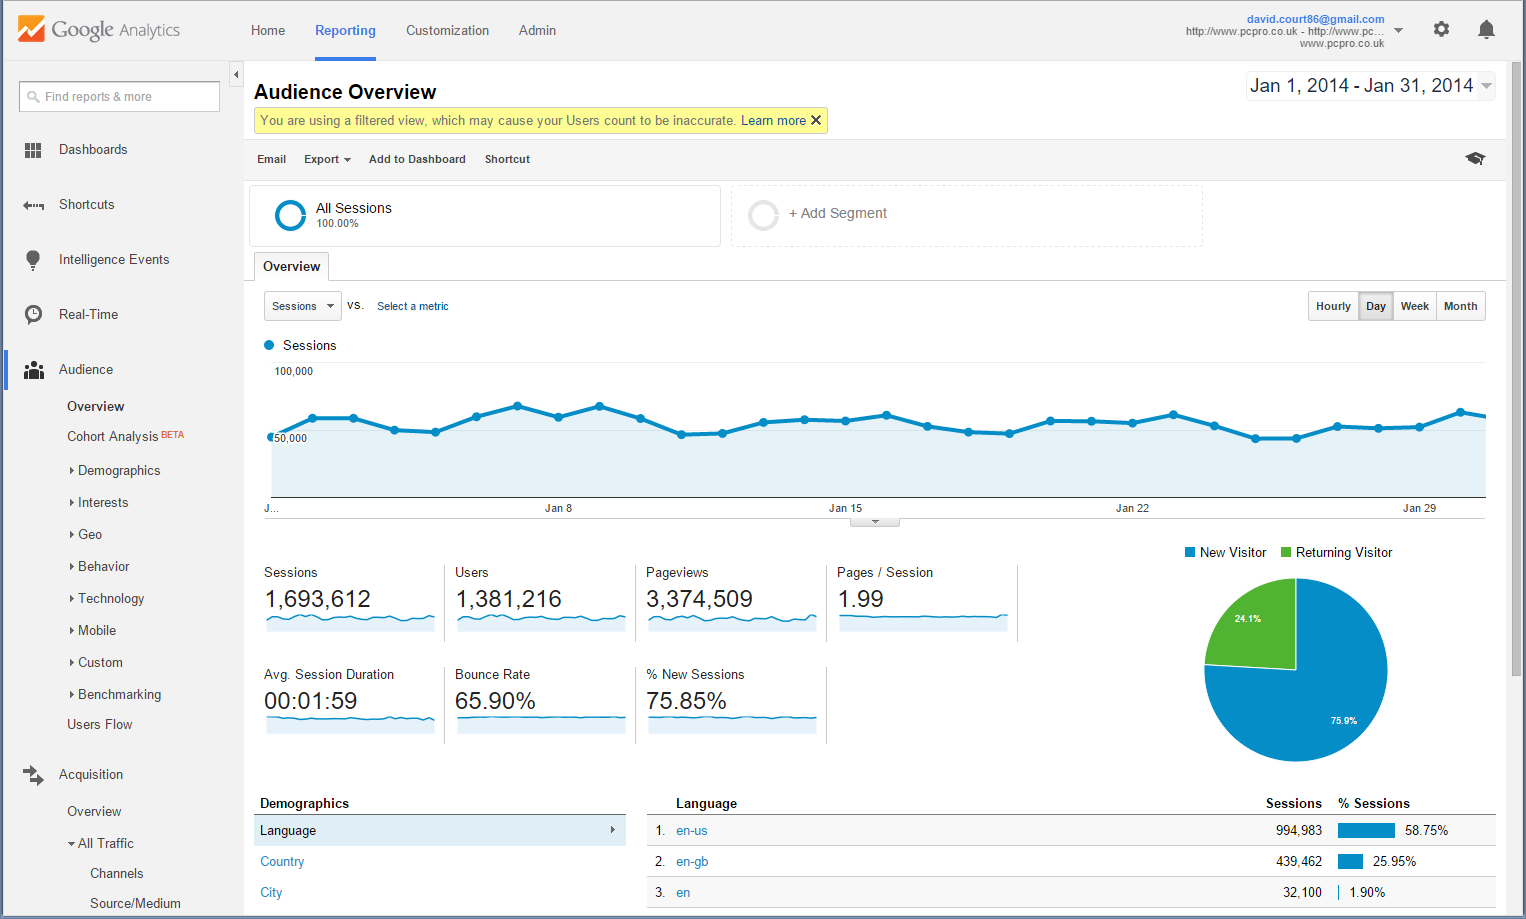
Your audience
Let’s start by looking at audience data. This is where you can find basic information such as how many users visited your site; the proportion of these that were new or returning; how many individual pages were seen by each visitor; and the average time spent your site.

What is the bounce rate?
There are also some metrics here that aren’t so self-explanatory. Your site’s “bounce rate” represents the proportion of visitors who land on your site and then leave again without clicking on anything. As a general rule, a bounce rate below 50% is acceptable — there’s a lot of casual browsing on the web — but a figure above 80% suggests that something about your site, or an individual page, is driving people away, and that ought to be addressed.
What is a session?
The total number of sessions measures individual periods of activity on a site. Essentially, a session is recorded when a user leaves your site and doesn’t return within 30 minutes (this time limit can be edited by going to Admin > Property > Tracking Into > Session Settings), or is simply inactive on your site for 30 minutes. The easiest way to understand this is to picture a visitor spending 29 minutes clicking around your site. During this time they follow multiple links, navigate to several different pages, and then leave. Google Analytics counts this as one session. If the user had gone away for 30 minutes or longer at any point, and then returned and continued interacting with your site, this would be registered as two sessions. Session data helps you understand how many pages users view on each individual visit to your site.
An example of when this would be useful is for working out how often to serve full-page promotions to a visitor. Serving a fresh promotion or advert to a user every five pages might annoy them if they skip pages in quick succession, doing so per session is a more rewarding experience for the user. Similarly you can more accurately judge how many pages an average users visits on your site before leaving with sessions.
If you want, you can drill down even further into your audience. Within two more clicks you can find out where in the world visitors are accessing your site from, who their broadband provider is, and what OS or device they’re using, as well as the distribution of age and sex. This sort of information can be terrifically valuable when it comes to tailoring your content or advertising to suit the right demographic.
Here we take a look at how Google Analytics breaks down traffic data.
How to use Google Analytics: Acquisition
Acquisition data tells you where your audience came from. This doesn’t mean where in the world they’re located (that’s under Audience, as mentioned above), but rather what online source directed them to your website.
Search vs social
If you’ve paid for an SEO (search engine optimisation) company or social media guru to overhaul your site, this is a section you’re going to want to focus on closely. This tab tracks which sites your users were visiting before they followed a link to your site, and filters this information into four different types of acquisition: organic search, direct traffic, referral traffic and social.
Organic search basically means search engines. If someone has landed on your site from Google, Bing, Yahoo, or even Lycos (it does still exist!) then it will be recorded here. Direct traffic is when a user arrives on your site with no previous browsing activity — in other words, when they type in your web address by hand, so you can expect your homepage to get the bulk of this direct traffic. It is advisable to take this figure as a guide rather than fact, however, as it’s thought that Google Analytics counts any source it can’t properly trace as direct traffic.

Referral traffic represents links from other webpages. This can be slightly misleading, as big aggregating sites such as Google News and Reddit are shown here, so the line between search results and referrals can be a bit blurred.
The last acquisition type is social. Here you can see how much traffic comes from social networks, as well as discovering which of your pages are most popular on each platform — that is, Facebook, Twitter, LinkedIn and so on.
Knowing the breakdowns of where you traffic is coming from can help you make decision on where to invest future resources. If you’re spending and equal amount of time trying to market your website via each medium mentioned above, Google Analytic’s broken down data can tell you how each is performing, and therefore give you the confidence to invest in the correct source in future.
How to use Google Analytics: Behaviour
Google Analytics’ behaviour data lets you see which pages on your site are attracting lots of visitors, and which are less popular. You can track the exact number of views and users each page has received, and if your site has an internal structure — the site map, to you and me — lets you see how each individual section of your site is performing.
What are my site’s top performing pages?
Under the heading “site content” you’ll see four different options. You can choose to view either page URLs or titles; if you want to see a list of your top articles, click on the All Pages tab. Here you can see view counts for individual pages, plus details of unique views, the average time spent on each page, entrances, bounce rates and exit percentage. If you’re looking for traffic information from a specific page, an easy way to find it is to paste its address (after your domain name) into the search box.
The next main thing you may want to look at in behaviour is the content drilldown tab, which lets you see how entire sections of your site are faring. On pcpro.co.uk, for example, we can see how many users are visiting our reviews section, versus the number coming to our features section. Such data can help you make decisions about where to focus your efforts and resources — for example, you might choose to invest in shoring up a section that isn’t as popular as it should be, or focus your energies on the parts of your site that get the most attention.

For the more advanced user, the next two sections will be important. These are the Landing and Exit Pages tabs. Landing pages are simply the pages that users are arriving to your site on, while exit pages are the last ones people visit before leaving your site. Any pages that stand out in either section deserve close attention, and as these may be driving up your overall bounce rate.
One final section worth paying attention to is the Site Speed tab. We recommend you sort the results on this page by average page load time, and try manually loading the slowest pages in a separate web browser. Visitors will lose patience if a page doesn’t appear almost instantly, so if you feel the page takes too long to load, consider reducing its complexity or reducing the size of images, so it opens more quickly.
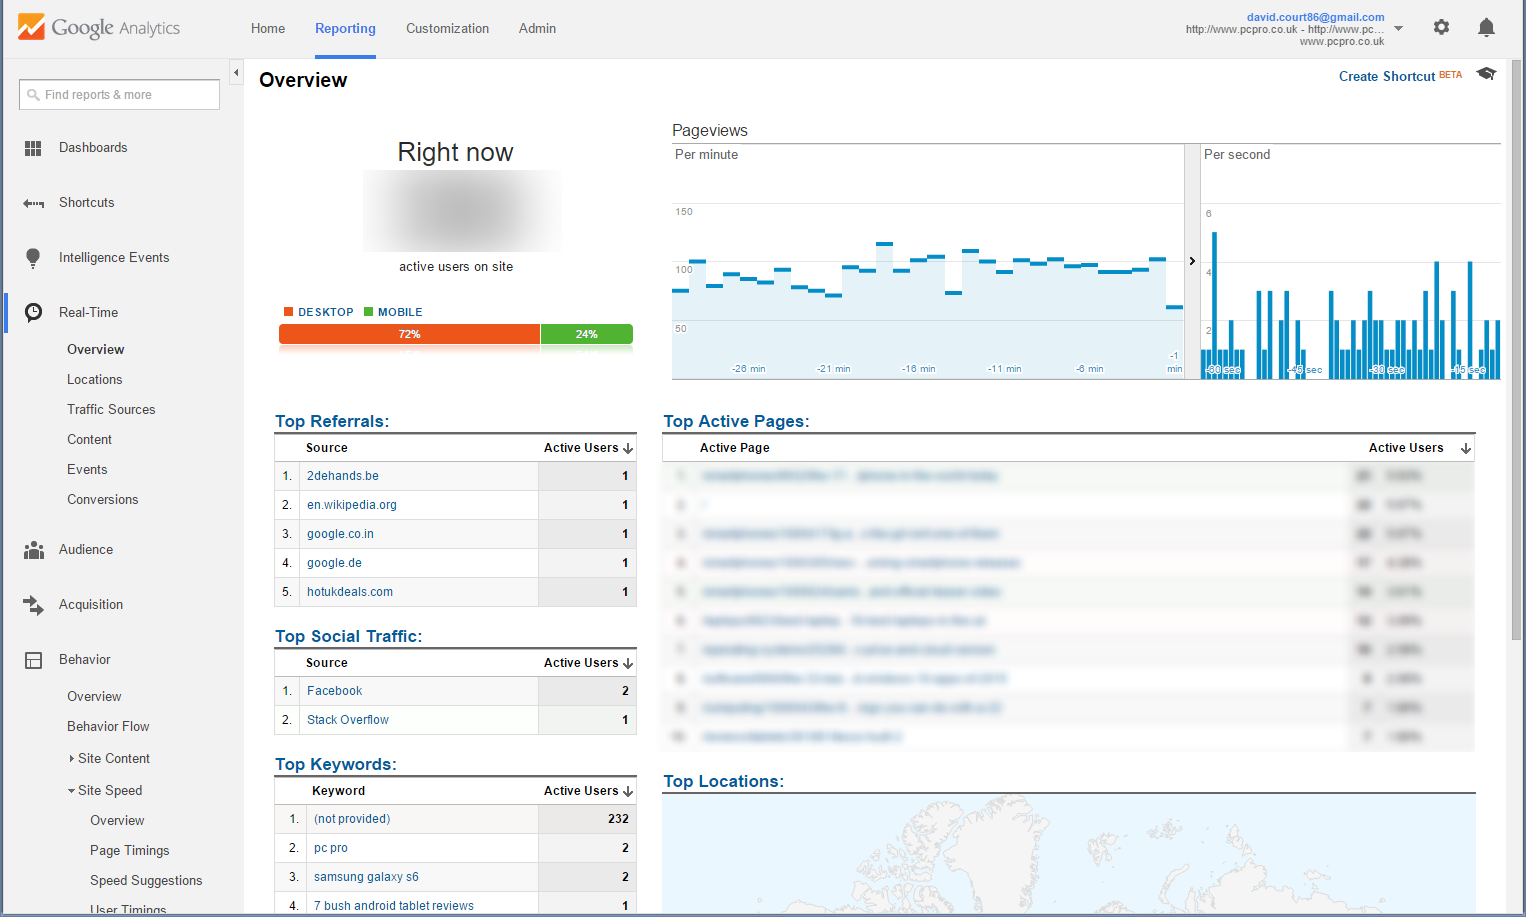
How to use Google Analytics: Real-time data
Google Analytics’ real-time data can give you an ego-boosting “right now” count of active visitors to your site — and you can also investigate further into who’s doing what. On the overview page you can see stats regarding top live referrals, active pages, social traffic, top keyword searches (to an extent as Google has started hiding a large percentage of this data) and top locations.
It’s easy to make too much of live statistics. If you’re in charge of a website, you shouldn’t make any decisions based solely on a single snapshot of visitor activity. However, real-time data gives you a valuable glimpse at what content is the most popular at certain points. Unexpected patterns of activity can also expose bugs: many commercial sites keep a live analytics view open running on a dedicated terminal at all times. We’ve certainly found that this approach can bring server-based errors or broken links to our attention before many automated services.
How to use Google Analytics: Summary
The great thing about Google Analytics data is that it automatically gathers data about what your site is and isn’t doing. With the guidelines detailed above you can start to turn this raw data into valuable information and then make intelligent changes to site. The beauty of Google Analytics is that if the changes you make don’t work, you’ll soon see via the Real-Time and legacy data, so you can revert back and reassess.
Alternatively, if the data-led changes you make do work (and there’s no reason they shouldn’t) Google Analytics will show you that in scores of ego-boosting graphs… which you can then use to fine tune your site again.
Disclaimer: Some pages on this site may include an affiliate link. This does not effect our editorial in any way.