Effective debugging and code quality are inseparable concepts in software development. Visual Studio (VS) Code’s debugging functionality is controlled mainly by the launch.json file. This file lets developers configure and manage their debugging settings according to their vision.
This article will guide you through opening and managing the launch.json file for optimal debugging.
Opening launch.json in Visual Studio Code
To configure and manage VS Code debugging settings, you will need access to the launch.json file. This file plays a crucial role in debug customization.
- Open Visual Studio Code.
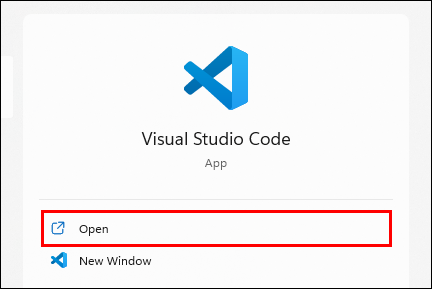
- Press Ctrl + Shift + P to open the Command Palette.

- Type “Open launch.json” in the Command Palette and press “Enter.” This should open the launch.json file for you.
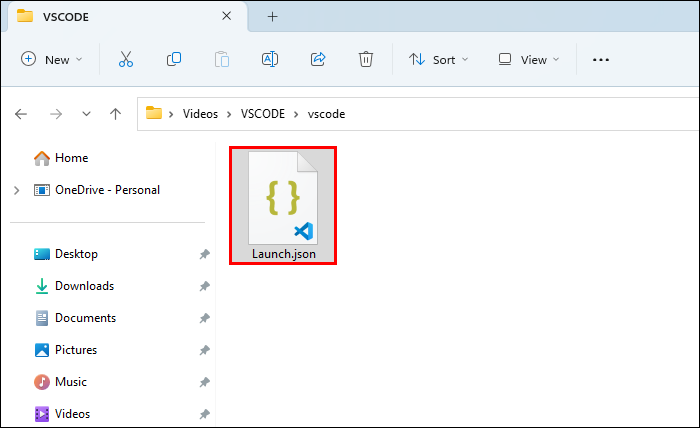
- If the launch.json file does not open, verify that the “.vscode” folder exists in your project’s root folder.
- If it doesn’t exist, create a new folder called “.vscode” within your User folder.
- Create a new “launch.json” file and place it in this folder.


The launch.json file will be ready to configure after enabling it.
Launch.json Structure Overview
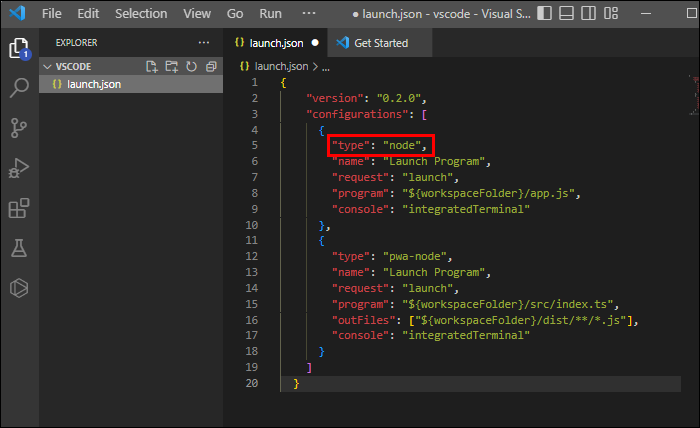
The launch.json displays the “version” and “configurations” sections. The “configurations” section is an array containing different debugging options, which you’ll use to configure your debugging scheme.
Each object in the “configurations” array represents a debugging scenario. These objects have properties that define the debugging environment, such as the language, program, and debugger settings.
Some common properties you’ll encounter in launch.json configurations include:
- “name” – A reader-friendly name for the configuration to identify it in the dropdown menu.
- “type” – Specifies the type of debugger (such as “node,” “python,” or “cppvsdbg”).
- “request” – Determines the request type, either “launch” (to start a new instance) or “attach” (to attach the debugger to an existing process).
- “program” – File path for the file you want to debug.
- “args” – An array of command-line arguments to pass to the program during debugging.
- “preLaunchTask” – A task to run before starting the debugger.
Understanding the launch.json file structure lets you know which options to change and which to leave alone while customizing your debugging environment.
Configuring Launch Settings for Different Languages
The steps for configuring launch settings can vary slightly depending on the language. Here are the steps for several popular languages.
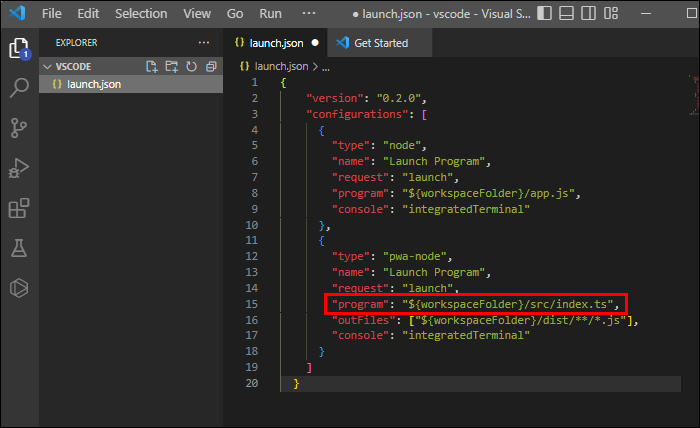
JavaScript and TypeScript
- Create a new launch.json file and configure the “type” property as “node” for JavaScript or “pwa-node” for TypeScript.
- Set the “request” property to “launch” or “attach.”
- You should specify the entry point file using the “program” property.


Python
- Install the Python interpreter and extension for Visual Studio Code.
- Set the “type” property to “python” in a new launch.json file.
- Configure the “request” property as “launch” or “attach.”
- Specify the Python file to run using the “program” property.
- You might need to additionally set the “pythonPath” property to the Python interpreter’s path if it’s not in the default location.


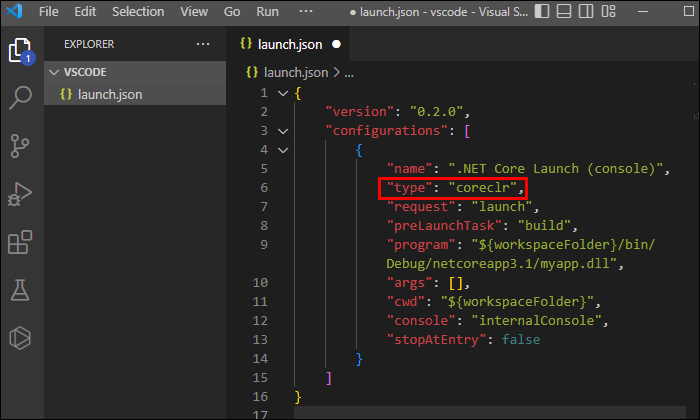
C# and .NET Core
- Install the C# extension for Visual Studio Code.
- In the new launch.json file, set the “type” property to “coreclr” for .NET Core or “clr” for the .NET Framework.
- Configure the “request” property as “launch” or “attach.”
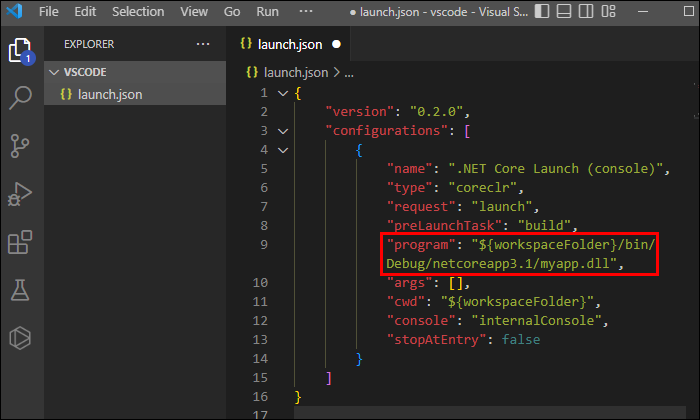
- Specify the entry point file using the “program” property.
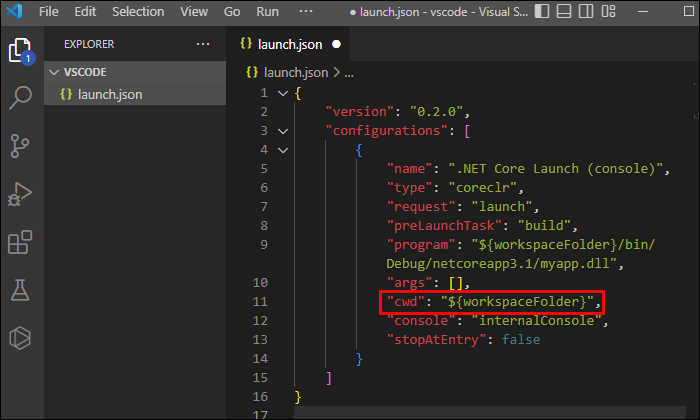
- Set the “cwd” property to the current project’s working directory if necessary.


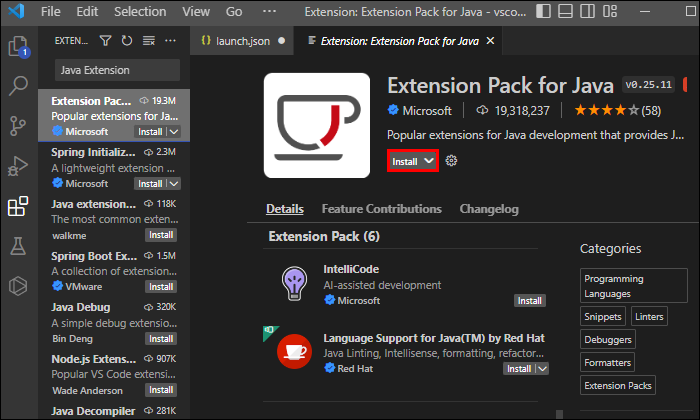
Java
- Install the Java Extension Pack.
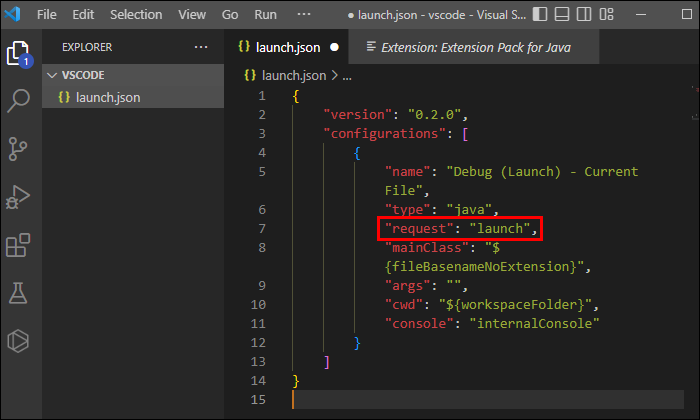
- Make a new launch.json file, and set the “type” property to “java.”
- Configure the “request” property as “launch” or “attach.”
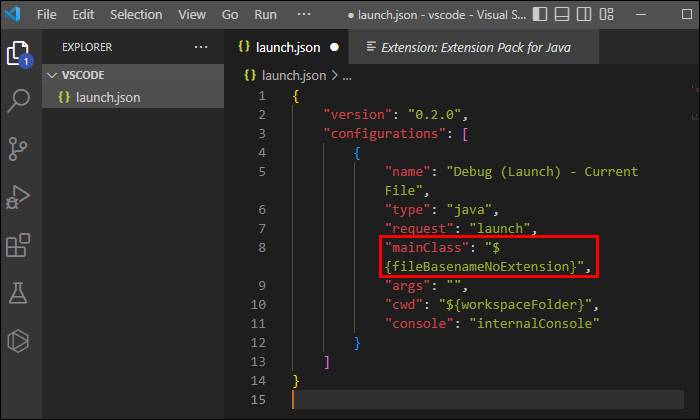
- Specify the main class with the “mainClass” property.
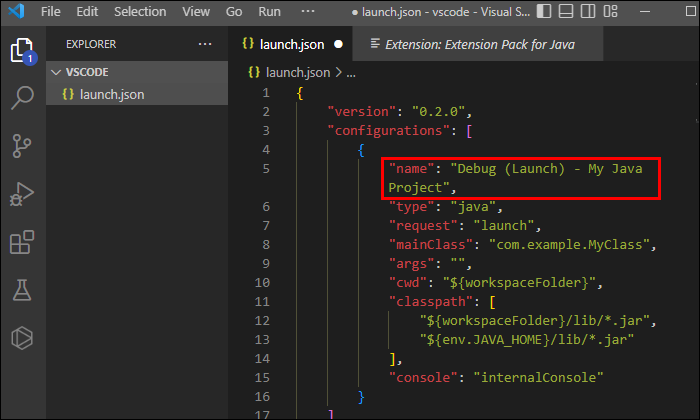
- Set the “projectName” property to the name of your Java project.
- Configure the “classpath” property to include the Java libraries you’ll use during your Java development.


Debugging Configuration Recipes
The following section covers various debugging configuration recipes.
Attaching Debugger to a Running Process
To attach the debugger to a running process:
- Set the “request” property to “attach.”
- Choose the process ID or filter to find the process to debug.


Remote Application Debugging
For remote application debugging:
- Use a “remote” type.
- Provide the host’s address, port, and possibly authentication information to establish a connection.
Debugging Unit Tests and Test Suites
When debugging unit tests and test suites:
- Use a configuration that includes the test framework and settings to debug unit tests and test suites.
- Define the test suite or individual test files in the “program” or “args” property for targetting specific tests.
Passing Environment Variables
The “env” property in launch.json can pass environment variables to your application while debugging. This property is an object that contains key-value pairs for the environment variables you want to set.
Advanced Debugging
Let’s explore some advanced debugging techniques for users who want to squeeze a bit more power out of the debug files.
Conditional Breakpoints and Logpoints
Conditional breakpoints and logpoints improve debugging by pausing or logging messages only under specific conditions. To use them:
- Right-click on the line number where you want to set a breakpoint or logpoint.
- Select “Add Conditional Breakpoint” or “Add Logpoint.”
- Enter the condition or message to trigger the action.
Source Maps
Source maps enable you to debug code that has been transformed or minified.
- Set the “sourceMap” property to “true” in your launch.json configuration to use source maps.
- Ensure your build process generates source maps and the transformed code.
Integrating External Debuggers
You can integrate external debuggers and tools, such as gdb or lldb, into VS Code if you wish.
- Install the debugger extension of choice.
- Configure the debugger’s settings in the launch.json file.
Debugging Multi-Threaded Applications
When debugging multi-threaded applications, you can control the execution of individual threads.
- Use the “threads” view in the Debug sidebar to manage the threads during a debugging session.
- You can pause, resume, or step through the code execution for each thread separately.
Multi-Target Debugging
Compound launch configurations enable debugging of multiple targets simultaneously. If you want to take advantage of this feature, add a “compounds” array with configuration names to group together. Run them by choosing the compound configuration name from the Debug dropdown menu.
Configure multiple launch configurations targeting different services, functions, or endpoints to debug microservices and serverless applications. Use compound launch configurations to run these targets together.
For multi-root workspaces, create separate launch.json files for each folder. Configure the launch settings for each root folder individually to debug projects separately or simultaneously using compounds.
Troubleshooting Common launch.json Issues
At times, debugging is prone to its own set of bugs. Let’s look at a few common issues and how to troubleshoot them.
Schema Validation Errors
Schema validation errors occur when a launch.json file has invalid properties or values. To fix schema errors:
- Review the error messages from the Problems panel.
- Update the launch.json file according to the information from the error message.
Debugging Failures
Incorrect launch settings can cause debugging failures.
- Check your launch configurations for incorrect file paths.
- Verify missing or wrong debugger or request types.
- Update the settings as needed.
Diagnosing Launch Configuration Issues
To diagnose issues with launch configurations:
- Enable diagnostic logging by setting the “trace” property to “verbose.”
- Review the generated logs in the Debug Console to identify and fix any problems.
Tips for launch.json
Use launch.json optimally with these tips:
- Use meaningful names for your launch configurations to make them easily identifiable. This practice helps you find the appropriate configuration quickly when working with multiple debugging scenarios.
- Share launch configurations with your team by including the launch.json file in your project’s version control system. Every team member can access the same debugging configurations and settings.
- Version control systems like Git can track changes to your launch.json file. You can use version control to revert to previous configurations and collaborate with other team members by sharing recommended settings with them.
- Install extensions that support specific languages, debuggers, or tools that suit the project’s demands. Configure the launch.json file to use these extensions and their features during debugging sessions.
Launch Into Debugging
By harnessing the power of launch.json, you can adjust your debugging experience to match your coding style best. This will enhance your code’s quality and performance.
How often do you have to configure your launch settings? Do you have any configuration tips? Please share your experiences in the comment section below.
Disclaimer: Some pages on this site may include an affiliate link. This does not effect our editorial in any way.