On this day, 72 years ago, the second atomic bomb of WWII devastated the Japanese city of Nagasaki.
It was dropped by parachute from an American B29 Bomber at 11.02am local time and exploded 1,625 ft (500m) above the ground. Approximately 30% of Nagasaki, including the industrial district, was destroyed by the bomb and some 74,000 were said to have been killed, with a similar number injured in the blast with the effects still prevailing today. Five days later, Japan surrendered.
Nuclear weapons have only twice been used in wartime – this 1945 bombing of Nagasaki as well as the initial bombing of Hiroshima, three days earlier. You could be forgiven for thinking, then, that nukes haven’t been detonated that often in human history. A couple of tests here and there, but nothing more, surely?
Wrong.
To date, there have been more than 2,055 known nuclear explosions. You can see 2,053 of them that occurred between 1945 and 1998 in the video below. For added sadness, consider the sheer number of schools and hospitals that could have been funded with each flashy detonation (there isn’t an exact figure on how much a nuke costs, but this article from Dr Lisbeth Gronlund explains you could be looking at $20 million per bomb or higher – discounting the billions of R&D that went into the initial technology).
That takes us to 1998. Then what happened? Well, nuclear testing had been being scaled back for some time due to the utter panic and terrifying doomsday scenarios induced by the Cold War. In 1963, the United Kingdom, USA and Soviet Union signed the Limited Test Ban Treaty, which pledged to avoid testing nukes in outer space, underwater or in the atmosphere. Two big nuclear players – France and China – were conspicuous by their absence, and continued atmospheric tests until 1974 and 1980 respectively.
Underground tests were a different story, but one by one they tailed off: the Soviet Union did its last underground detonation in 1990, the UK in 1991, America in 1992, and France and China in 1996. All the major players signed the Comprehensive Nuclear-Test-Ban Treaty in that year. The threat has been ramped up more recently, though, following tests by North Korea. Overnight, US president Donald Trump threatened North Korea with “fire and fury like the world has never seen” if Kim Jong-un did not relent.
So how does it stack up over time? I made this graph to put things into perspective, and to see exactly who the worst offenders are: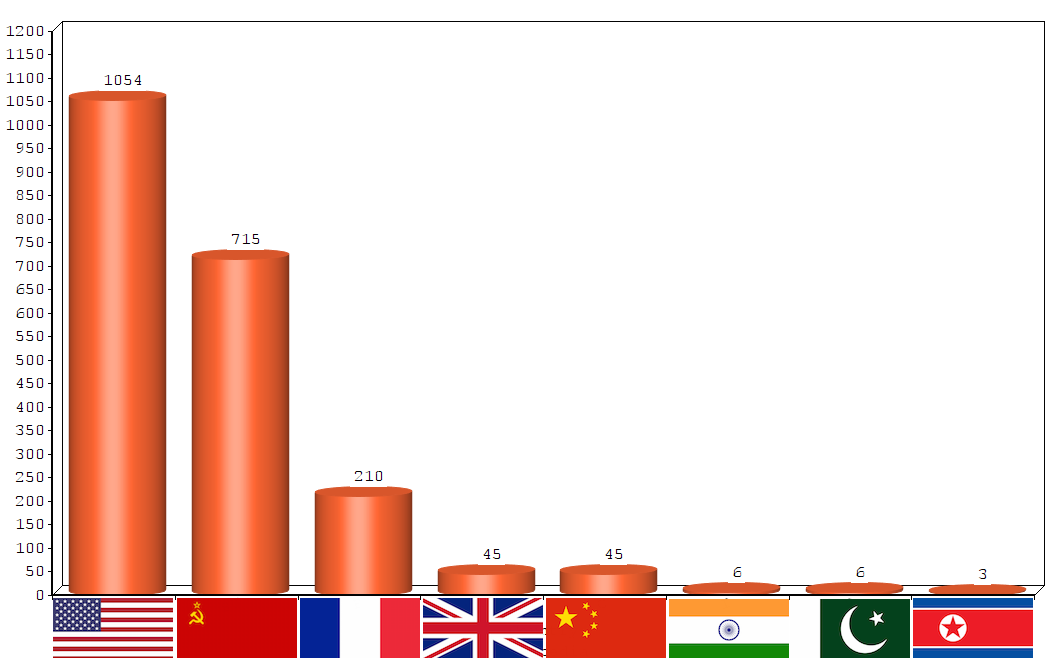
Since the Comprehensive Nuclear-Test-Ban Treaty was signed in 1996 up to 2016, there were 15 known nuclear tests. India and Pakistan were responsible for at least 12 of those. The final three were North Korea in 2006, 2009 and 2013. Come 2017, however, North Korea has fired 18 missiles during 12 tests since February.
A lot of money has been spent, and continues to be spent, on upkeep and security for nuclear weapons – money that would undoubtedly be better spent elsewhere. And yet, if there is one slightly upbeat message to end on, it’s that we’ve come a long, long way from the days of the Cold War, as this graph shows: 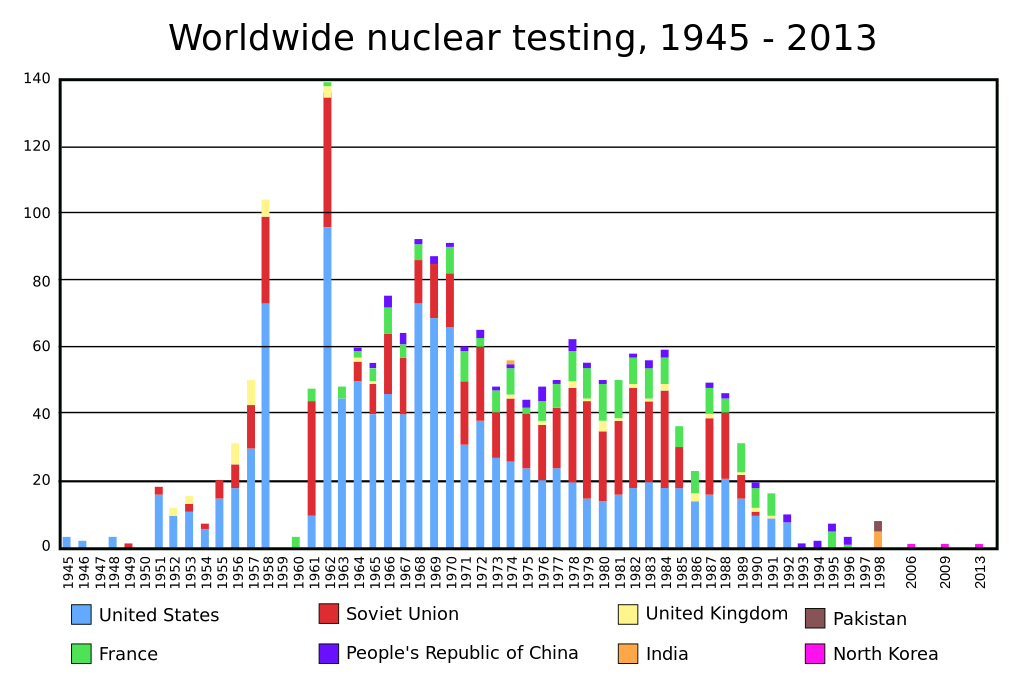
Within the context of more than 2,055 nuclear explosions, the fact that we’ve had just three this century – all from a pariah dictatorship – isn’t that bad. Right?
This story was originally published in 2015.
Disclaimer: Some pages on this site may include an affiliate link. This does not effect our editorial in any way.