In the business world, it’s important to be aware of percentage changes. Whether tracking your company’s growth or determining how much you’ll earn on a new investment, percentage changes can be critical factors in making informed decisions.
Thankfully, Google Sheets makes it easy to calculate percent changes quickly and easily. This guide will show you how to do so in a few simple steps. Let’s get started.
Calculating Percent Change
To calculate the percent change between two numbers, subtract the first number from the second number, then divide the result by the first number. The resulting decimal is multiplied by 100 to give the percent change increase or decrease as a whole number.
For example, if a variable increases from 10 to 15, the percent change can be calculated by subtracting 10 from 15 (15-10=5) and then dividing 5 by 10 (5/10=0.5). This gives 0.5, which, when multiplied by 100, gives 50 (0.5*100=50). Therefore, there is a 50 percent increase from 10 to 15.
The same principles apply when calculating a decrease. Simply reverse the order of the numbers when subtracting to get a negative result instead of a positive one.
For example, if the variable decreases from 15 to 10, the percent change can be calculated by subtracting 15 from 10 (10-15=minus 5) and then dividing minus 5 by 15 (minus 5/15=minus 0.3333). This gives minus 0.3333, which, when multiplied by 100, gives 33.33 (0.3333*100=33.33). Therefore, there is a 33.33 percent decrease from 15 to 10.
Calculating Percent Change in Google Sheets Using the Simple Approach
The simplest method to calculate the percent change in Google Sheets is as follows.
- Open up Google Sheets and create a new sheet.

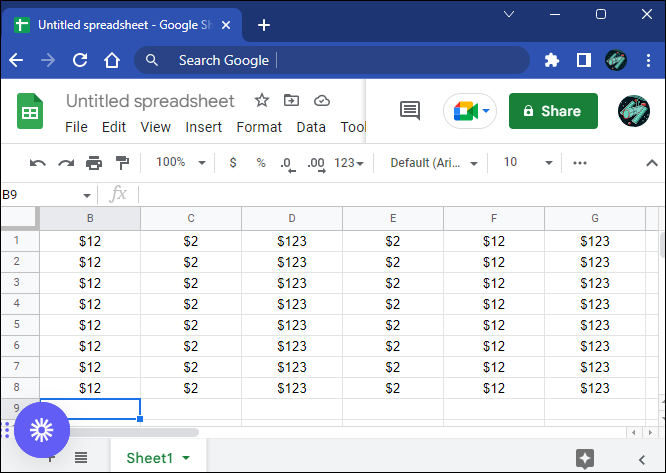
- Enter your data into the sheet. For this example, we will use sales numbers for ten years, with the most recent year’s sales on the left.

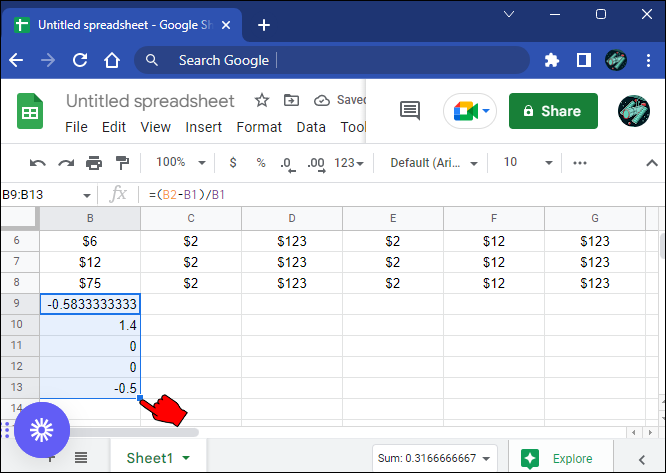
- In a new column, calculate the percent change from the first year. To do this, use the formula “
=(B2-B1)/B1”, where B1 is the second year’s sales and B2 is the first year’s sales. - Press “Enter” to generate the percent change for the second year.
- Use the drag fill handle to auto-populate the percent changes for the remaining period.


Now you’ll be able to see at a glance how much your sales have increased or decreased each year.
The problem with this method is that it doesn’t calculate the percent change in actual percentages, but rather in decimals.
So, for example, if B2 (first year’s sales) is 10 and B1 (second year’s sales) is 15, the percent change will be given as 0.5. You’ll need to convert this to 50% manually.
Calculating Percent Change in Google Sheets Using the TO_PERCENT Function
The TO_Percent function is a handy tool for calculating the percent change in your data. One of the best things about this approach is that it overcomes the weakness of the simple approach we’ve discussed above by automatically converting the changes from one cell to the next to actual percentages. This is convenient, and makes it easier to understand and interpret the data.
Here are the steps to calculate the percent change using the TO_PERCENT function. Again, we assume that we have sales numbers for ten years.
- Open up a new Google Sheet and enter your data.
- In a new column, use the formula “
=TO_PERCENT((B2-B1)/B1)“, where B2 is the sales for the first year and B1 the sales for the second year. - Press “Enter.” This will give you the percent change for the second year.
- Drag the fill handle across the remaining cells in the percentages column to automatically calculate the remaining percent changes.


So, for example, if B2 is 15 and B1 is 10, the percent change will be given as 50%.
Percent Change Compared to One Cell in Google Sheets
In most cases, we’re interested in the percent change from one period, say a year, to another, with the reference always being the period preceding the current one. For example, when calculating the percent change for the second year, the reference is the first year, while the reference for the percent change in the third year is the second year.
But what if you want to use the same reference to calculate the percent change across all years? You may want to calculate the percent change based on the first year only. To do so, you need to convert the cell that contains the entry (sales) for the first year into a reference cell by adding the “$” sign before the column letter and row number.
Using the TO_PERCENT function to do your calculations, here’s what the formula for the percent change in the first year would look like.
=TO_PERCENT((B2-$B$1)/$B$1)
You may still auto-populate the percent change across the remaining years using the drag fill handle, but the reference cell will be B1 throughout.
Track Progress Using the Percent Change
Percent change is a relatively simple concept that can be useful when you want to track progress. For example, you might want to track how your sales compare from one month to the next, or you might want to compare the percent gain in two different stock prices over time.
For calculating percent change, you can use a simple formula. And thanks to the drag fill handle, you don’t need to calculate the percent change for all periods. Simply use the first result to auto-populate all the remaining cells.
Have you tried calculating the percent change in Google Sheets using the methods discussed in this article? If not, give it a try and let us know how it goes in the comments section below.
Disclaimer: Some pages on this site may include an affiliate link. This does not effect our editorial in any way.