If you’re working with larger data sets in Google Sheets, comparing variable values can be a tedious process. Luckily, normalization is a statistical method that will help you sort complicated values into easy-to-compare data sets.
This article will explain what normalization is and how you can normalize data in Google Sheets for statistical benefits.
How to Normalize Data in Google Sheets
Suppose we have some numerical values in cells ranging from A2 to A50. To normalize that range into values between X and Y, here’s what you need to do:
- If your first data point is in A2, the first normalized value can be found by using this formula:
(Y-X)*((A2-MIN($A$2:$A$50))/(MAX($A$2:$A$50)-MIN($A$2:$A$50)))+Y
Use the numerical values for X and Y directly.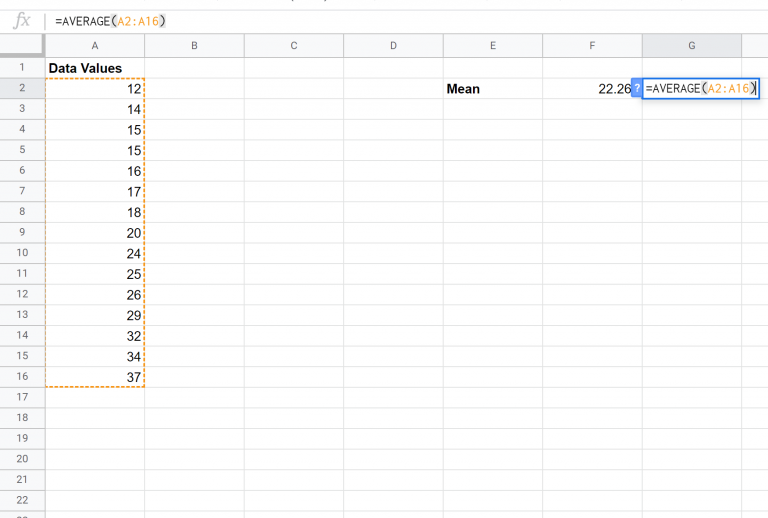
- Once you’ve put in the formula for the first number, move the mouse cursor to the bottom of the cell until it becomes a cross. Then, press and drag the cursor down to fill the remaining rows with the formula. Google Sheets will automatically replace A2 with the corresponding row number for the remaining cells, while everything behind $ symbols won’t change.

- If you want to refer to the values of X and Y from other cells in the sheets, you need to put $s before the row and column of the cells the values are in (for example, $D$5), or copying the formula might give you a parsing error or wrong results.
- Your data will now be normalized between X and Y values.


Normalizing your data is a great way to gauge the differences between two data sets with different minimum and maximum values.
How to Use Google Sheets as a Database
Every database is essentially a large table (or many connected tables), governed by a database management system. If you’re working with a relatively small data set that doesn’t need to scale too much, Google Sheets can be used as your database.
If you want to start using Google Sheets as your database, you will need to have a background in basic programming. You’ll also need an API to make the sheet compatible with SQL and Python. While Google offers a comprehensive API for its services, it might be a bit too much to handle. Therefore, we recommend sheet2api or Autocode to solve the API need. The API services will provide the connection and authentications necessary to connect your Google Sheets as your database and offer sufficient endpoints to enable proper database workflow.
The main benefit of using Google Sheets as a database is that you can always have a visual overview of all the data. Since Google Sheets is available as an app for mobile devices and is compatible with most browsers and operating systems, your database can be accessed from anywhere in the world. You can also directly overview and edit data in the sheet itself, rather than using code to run a query through the database to make changes.
However, Google Sheets has its limitations on database management. For one, there is a distinct lack of relational functions. Databases are usually composed of many tables using foreign keys to communicate with each other, a process that simply doesn’t exist in a single spreadsheet.
If you want to take a look at an example, consider the departments in your company. In a spreadsheet, these would usually just be typed-out strings. However, that is unwise for a larger data set. In databases, you’d have a separate table for company departments, with each department numbered accordingly. You’d then reference the department’s number in the data about an employee, using a foreign key. Having a separate department table allows you to make direct changes to the departments themselves without running the changes through the entire database.
Additionally, Google Sheets can only store five million cells at a time. While this might seem like a large number, even mid-sized companies can have databases that go well over this limit. Furthermore, you’ll reach performance issues much faster before you reach the cell limit. With a seemingly linear scaling between the number of cells and performance, you will have significant delays when working with a database containing 100 thousand cells.
Additional FAQ
Can You Insert Data in Google Sheets?
Google’s incorporated API allows you to insert a table directly from files. The File import tool supports the following extensions:
• .xls
• .xlsx
• .xlsm
• .xlt
• .xltx
• .xltm
• .ods
• .csv
• .txt
• .tsv
• .tab
Additionally, third-party software usually has integrations with Google Sheets. Sheets2api and Autocode, which we previously discussed, both have API solutions to provide data insertion into existing tables.
You can also use the IMPORTRANGE function to insert data from one Google sheet to another.
Google also has scripting instructions to write content into a spreadsheet.
If you manage to find an API solution that works for you, you can easily insert data into Google Sheets once you’ve connected it to your platform.
How Do I Clean Up Data in Google Sheets?
Google Sheets offers several solutions for cleaning up and sorting through data.
If you’re using Google Forms to collect survey results, you can set up Forms to automatically paste responses into a spreadsheet, rather than pasting the data manually.
Google Sheets also has a Data validation feature. If you go to Data > Data validation, you can set up validation features to prevent incorrect values. For example, you can make a list of items that can be put into a particular column, and trying to insert anything else will result in an error.
Google Sheets also has “Remove duplicates” and “Trim whitespace” options. This will remove any extra values and whitespaces from your rows and cells.
If you want to paste more organized data from online pages, use IMPORTHTML or IMPORTXML to get the information you need from a webpage, without the additional clutter.
What Does It Mean to Normalize Data?
In statistics, normalizing data will allow you to make varied data sets more comparable.
When you normalize data, you can change the original numerical value range to a range of your choice. For example, you can normalize different scoring methods into the same value range to compare them to one another.
Normalizing a value x that comes from a range (y,z) to a range (a,b) is done by the following formula:
X_normalized = (b – a) * ((x – y) / (z – y)) + a
Normalizing data is useful when your original datasets don’t have clean values. For example, standardizing the ranges to (0,100) can help provide a quick overview of scores independent of the maximum value of the scores themselves.
An additional statistical method in data evaluation is standardization. This puts the original numerical values to have a mean of 0 and a standard deviation of 1. The standardized values are often called z scores.
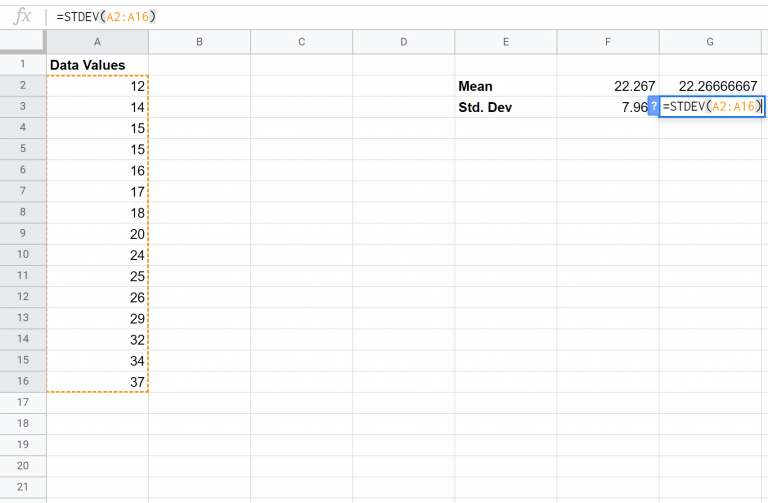
Google Sheets has a function that allows you to standardize a data set. The STANDARDIZE(x, mean, standard_dev) function will put the numerical value, x, in its standardized form. You can use the AVERAGE(range) function to get the mean value of your data in the table and use the ST_DEV(range) function to calculate the dataset’s standard deviation.
Interpreting standardized data is a bit different. For example, a standardized number of -1.5 means that the original value is smaller than the average by 1.5 times the standard deviation of the set.
Standardization can be useful to compare the values of different data sets with different expectations and means. Since a standardization always puts the mean to 0 and a deviation to 1, the actual values presented in the dataset won’t interfere with the comparison.
Statistical analysis can also transform a dataset to suit a particular distribution, but that is an advanced statistical feature that won’t be covered in this guide.
New Normal
Normalizing datasets is an incredibly useful tool in data analysis, and Google Sheets offers a quick solution to normalize numerical data. Furthermore, you can use Google Sheets as a small database, if you don’t work with extraordinary amounts of datasets for your work. The integrations Google Sheets has with third-party software make it suitable for a wide range of industries. However, proper databases will be much more scalable.
What type of information do you usually normalize in Google Sheets? Are you using Google Sheets for your database? Let us know in the comments section below.
Disclaimer: Some pages on this site may include an affiliate link. This does not effect our editorial in any way.