CapCut has a huge number of features to help you create stunning videos. Besides basic editing functions, you can also incorporate graphs into your projects. They make your creations much smoother and let you add a unique touch to your work.
If you’re not familiar with this feature, worry not – this article will explain how to use CapCut graphs in-depth.
How to Use Graphs in CapCut
The primary purpose of graphs in CapCut is to enhance the transition between keyframes. They make the animations smoother, dynamic, and produce many other effects to improve the quality of your clips.
However, you can only use this feature on videos with keyframe animation effects. They enable you to determine the directions of your zoom movements and highlight certain objects. Therefore, we’ll first demonstrate how to include keyframe effects:
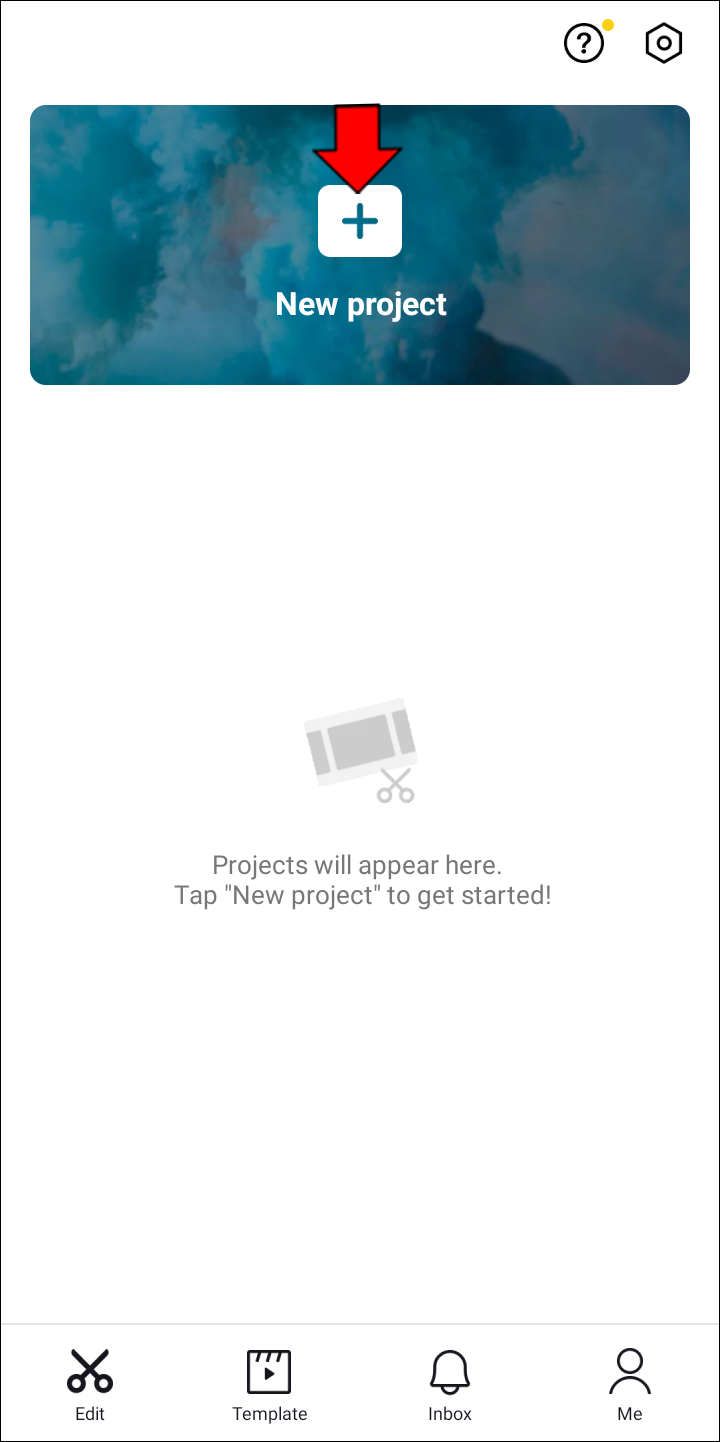
- Open CapCut and press “New Project.”

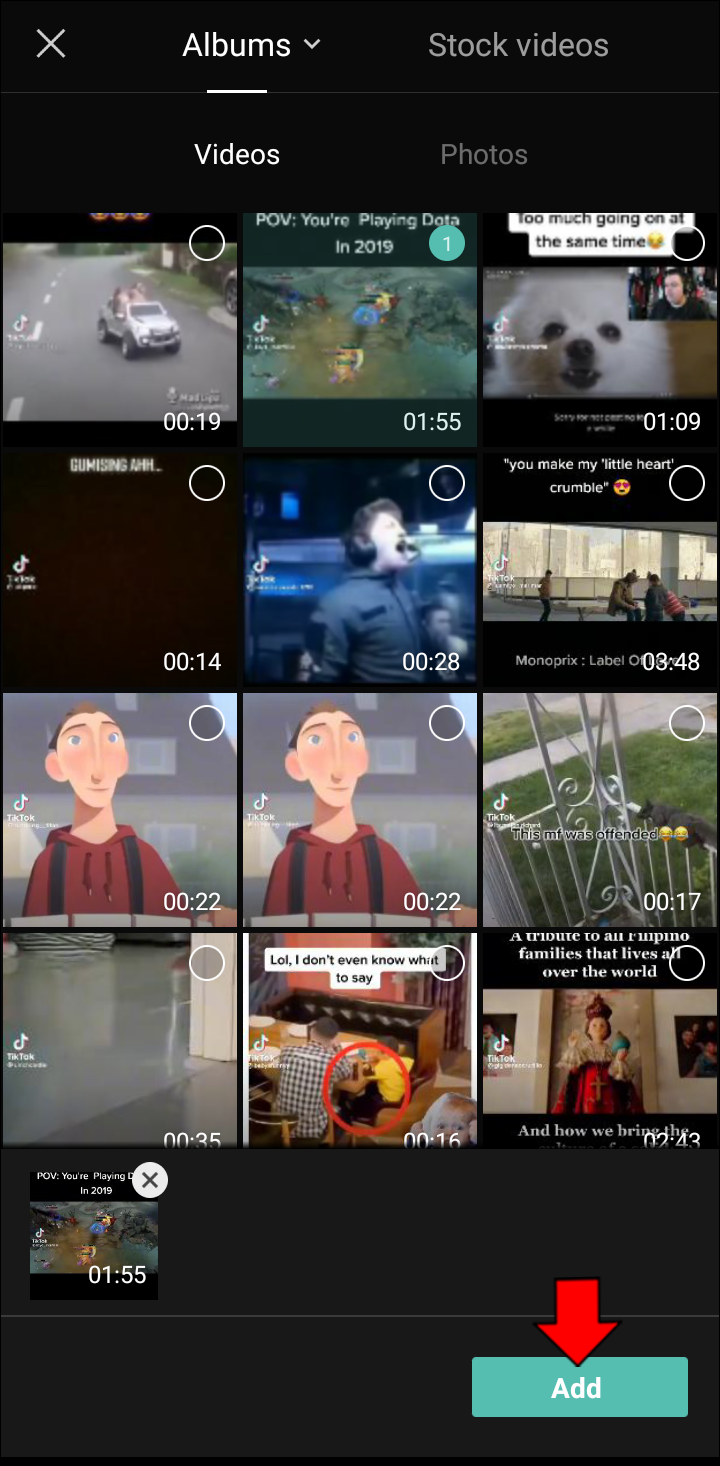
- Select the video you wish to edit.

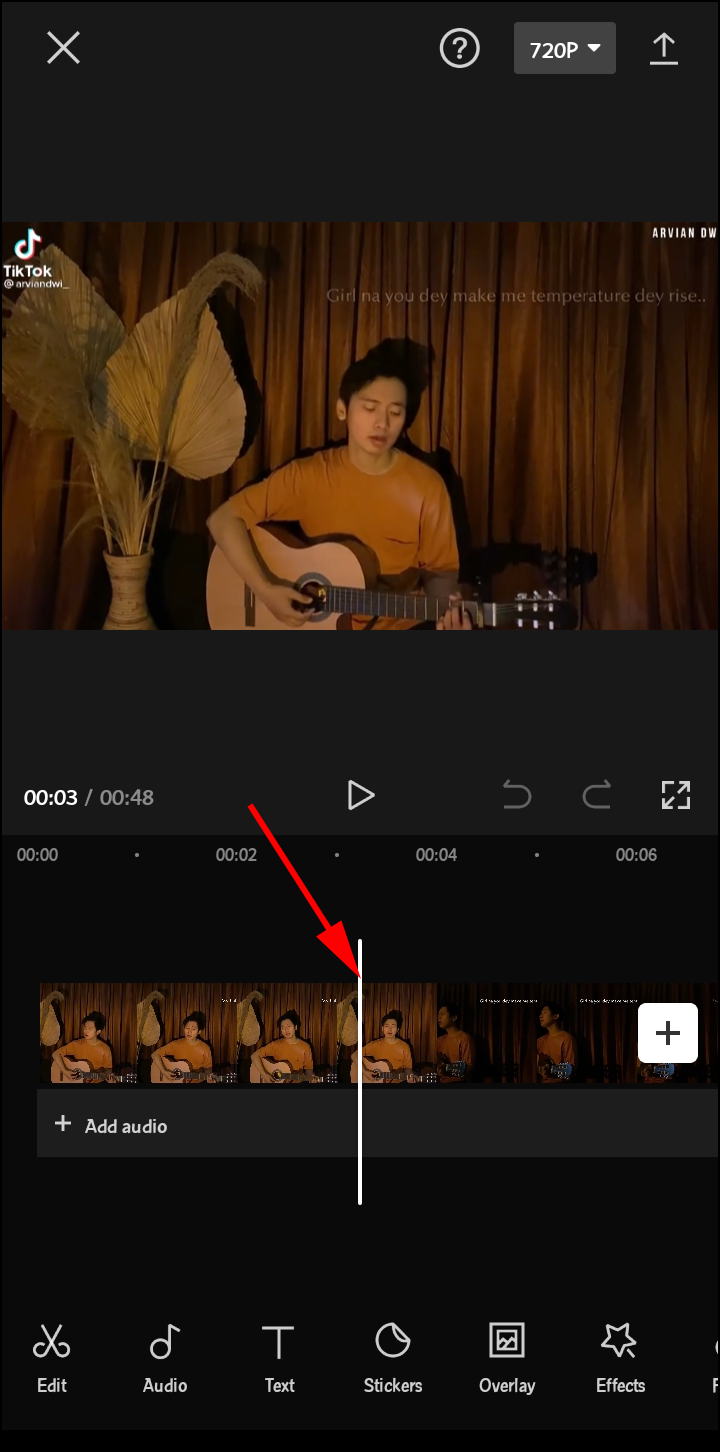
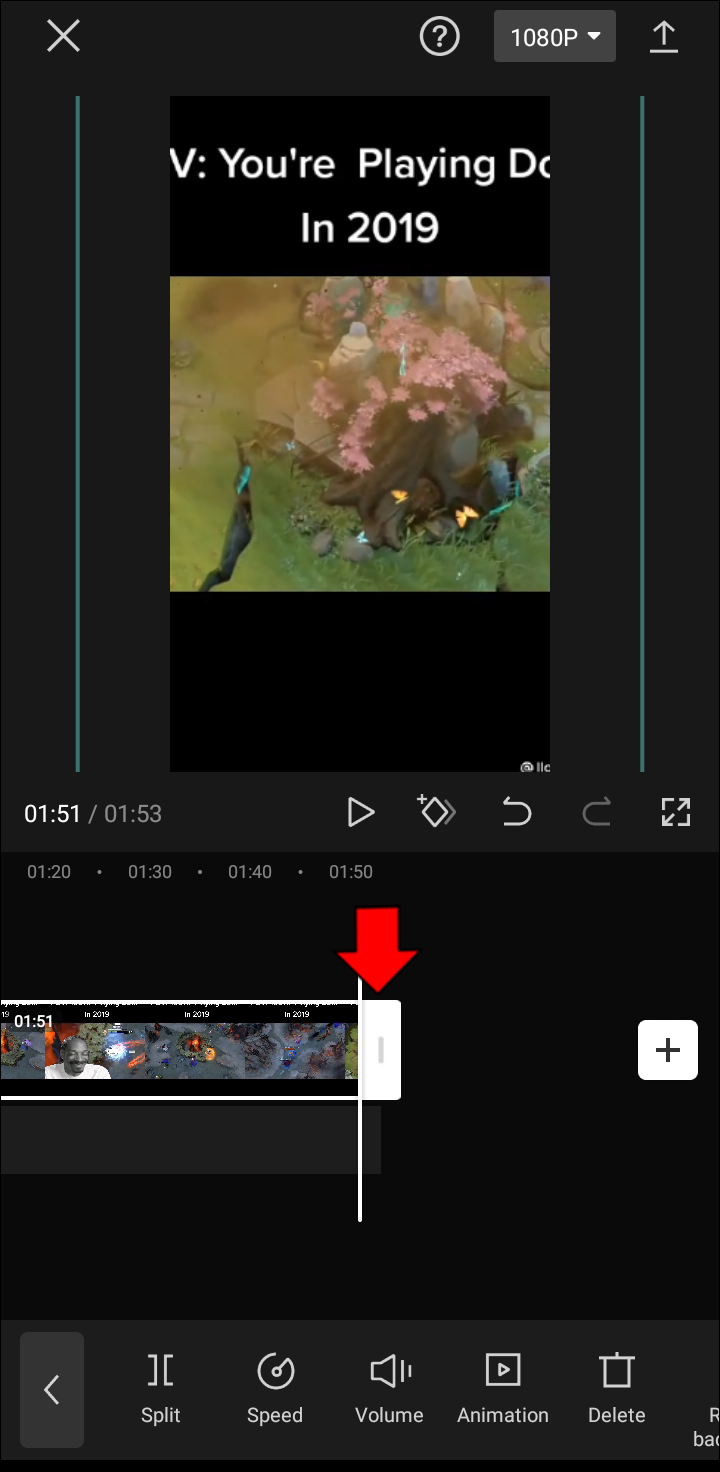
- Specify the point of the clip where the zoom effects will start.
- Tap the layer of the video to bring up your editing menu.
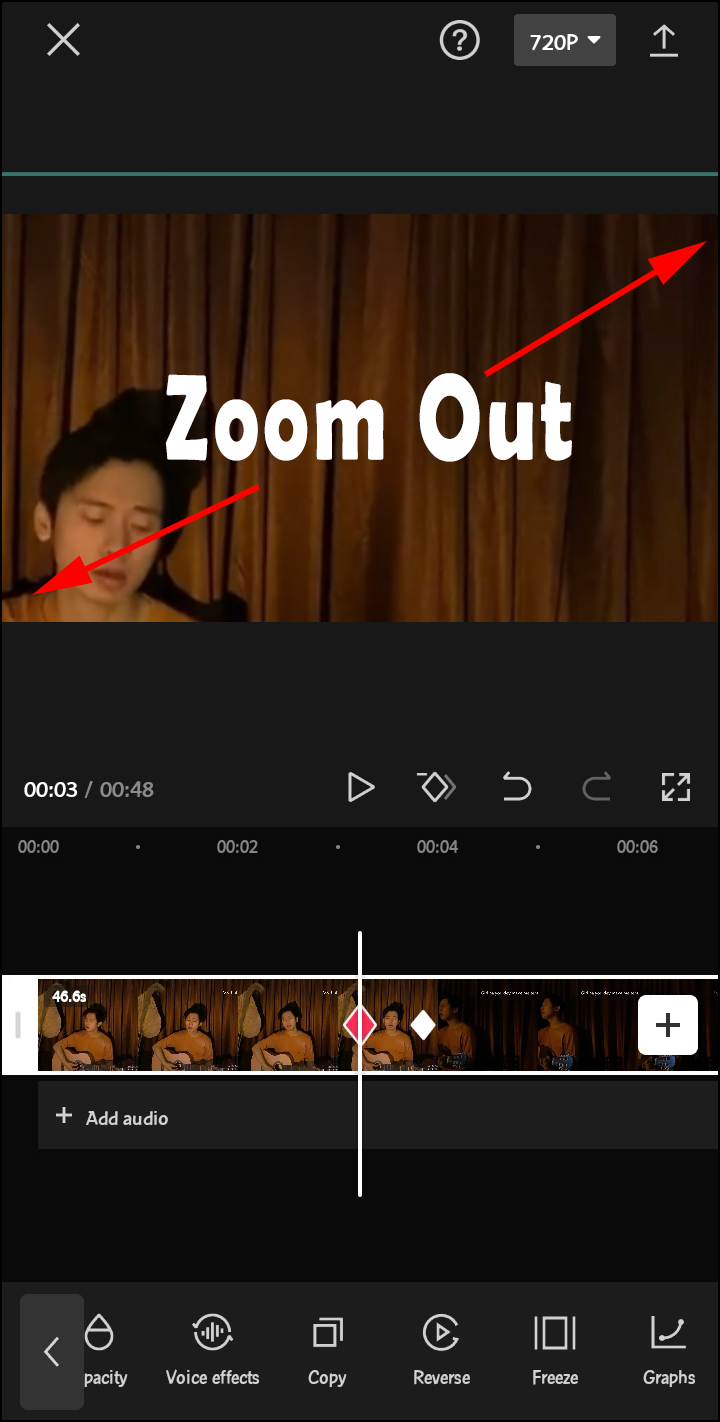
- Hit the keyframe symbol, and a dot should appear on your layer.
- Select another point of the clip. This will be the end of your zoom motion. Repeat this process to add as many keyframes as necessary.
- Zoom and pan the screen of the clip, pointing to the object you wish to highlight. Keep in mind that the wider apart your keyframes are, the slower your video zoom movements will be.
- Press play to check out the result.


Now that you know how to include keyframes, it’s time to embellish your videos with graphs:
- Open CapCut and create a new project.
- Add a clip you wish to edit.
- Perform any customization, such as lengthening the duration or reducing the size of the screen.
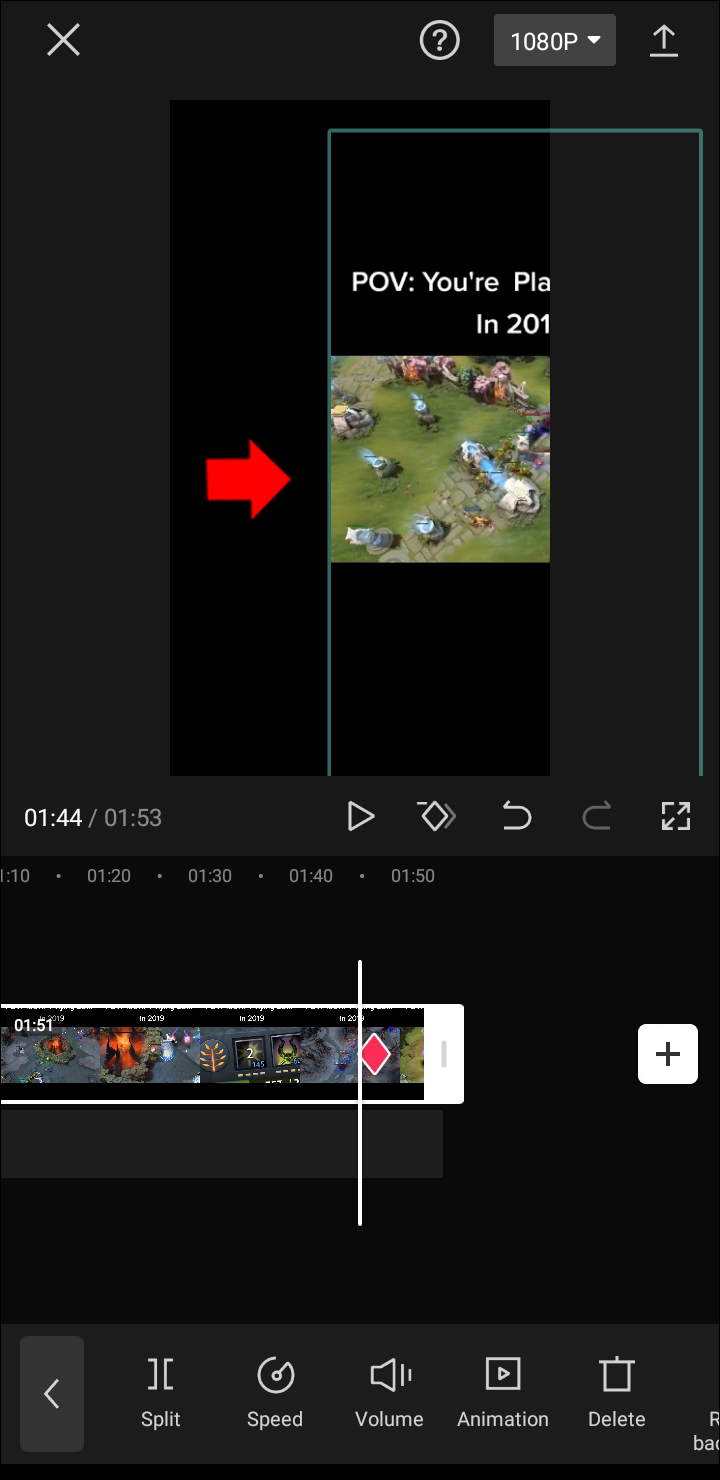
- Add two keyframes using the above steps. For instance, you can add one at the beginning and one at the end of your video.
- Use the second keyframe to move your video to the far right of your screen.
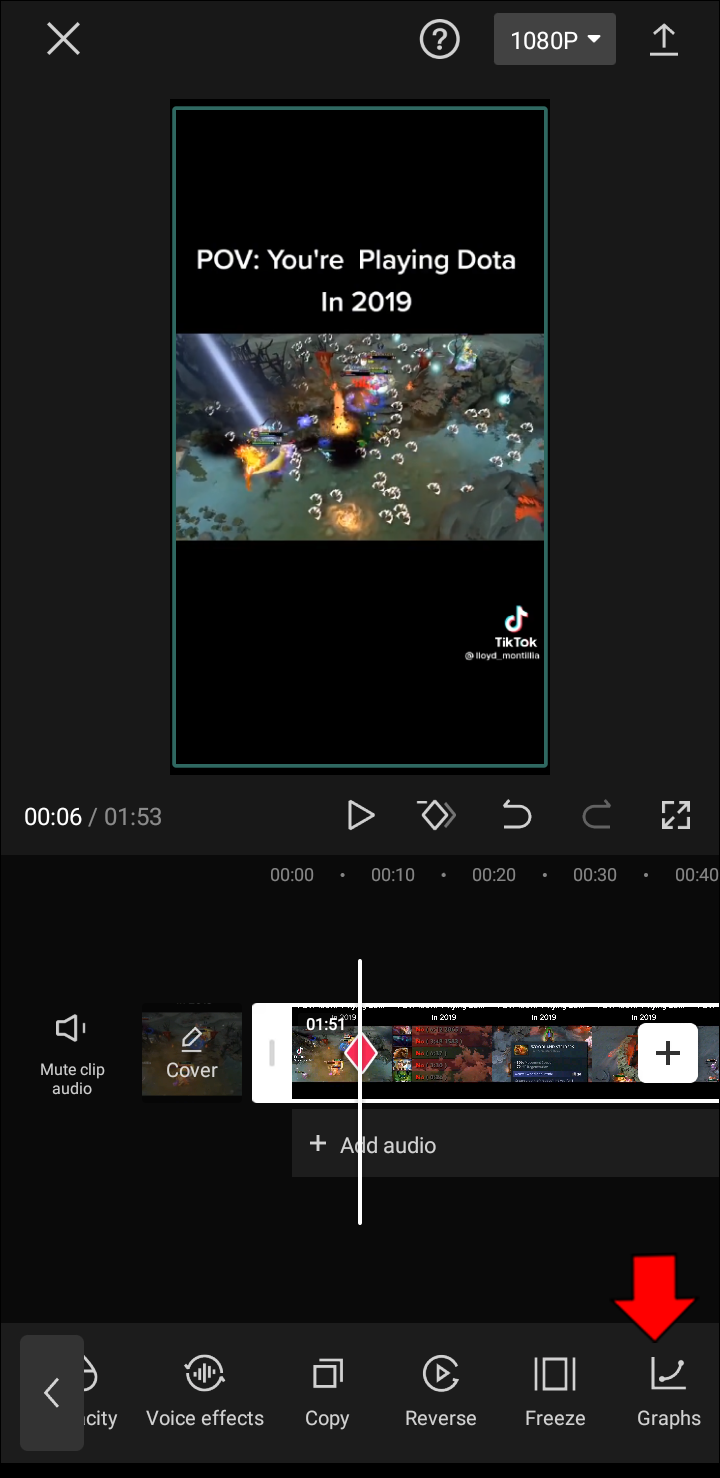
- Place the video between the two keyframes and open the graphs menu. It should be the final option on the toolbar in the lower part of the display.
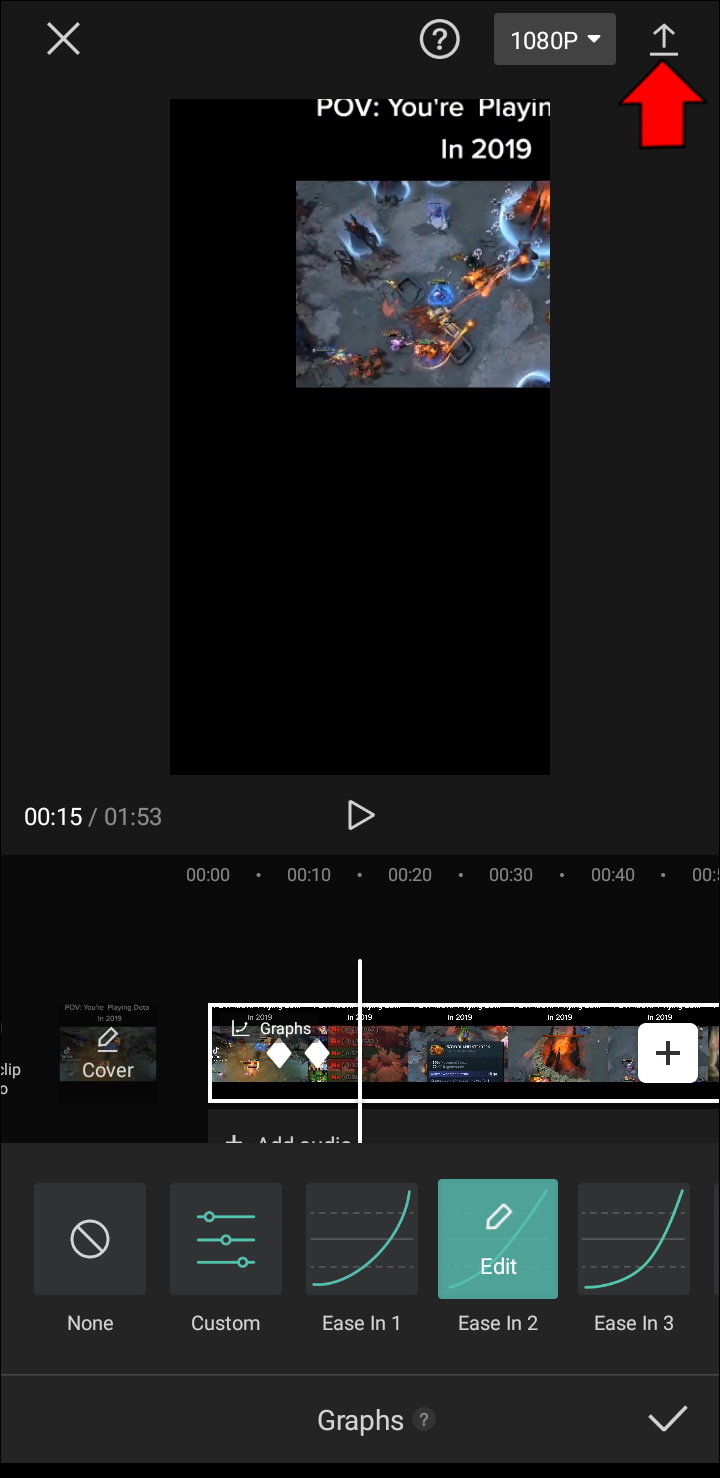
- You have a variety of graphs to choose from. Some of your options include Masuk 1, Masuk 2, Keluar 1, and Keluar 2. You can edit each item by tapping the pencil symbol that appears when hovering over the graphs.
- Alternatively, press the button after the “None” icon to create and modify your own graph effects. This allows you to add beats to any point of the video. The higher and closer the beats are, the faster the animation will move. If you set a beat lower than the beat behind it, the animation movement will be backward. Use the “Delete beat” button in the upper-right corner of the menu to remove beats you’re not happy with.
- Play the video.
- If you’re happy with the result, export the clip to your gallery by pressing the “Upload” icon in the top-right part of the screen. Wait for the system to move the project to your gallery. You can now play the media without using CapCut and share it on social media.


Take Your Videos to New Heights with Graphs
Graphs in CapCut are a fantastic way to customize your videos. They allow you to upgrade from default transitions into something more appropriate to your clips and audience. As a result, you can strike a chord with your followers and impress many people with these mesmerizing effects.
You can also include stickers, emojis, filters, and music if you need an extra kick. The slow motion effect is another convenient tool that can make your videos even more enticing.
How often do you use CapCut to edit your videos? What is your favorite graph effect? Have you ever created your own Graph in CapCut? If so, what results did it produce? Share your experiences in the comments section below.
Disclaimer: Some pages on this site may include an affiliate link. This does not effect our editorial in any way.