Programming in VS Code isn’t easy. Even the tiniest mistakes can cause massive problems and hinder your projects. To overcome these obstacles, you need a reliable debugging technique in your toolbox. This is where breakpoints come into play.
Breakpoints are used whenever you wish to pause your debugger execution. They let you examine the state of your code variables and perform many other tasks crucial for resuming your programming. That’s why understanding how to use breakpoints in VS Code is indispensable.
In this entry, we’ll give you an in-depth guide on employing VS Code breakpoints. You’ll learn about the most popular types and find out how they can facilitate your development.
How to Use Breakpoints in VS Code
Breakpoints in VS Code can be placed in any executable code. It works for method signatures, declarations for a class or namespace, and even variable declarations if there are no getters/setters or assignments.
To set a breakpoint in your source code, take the following steps:
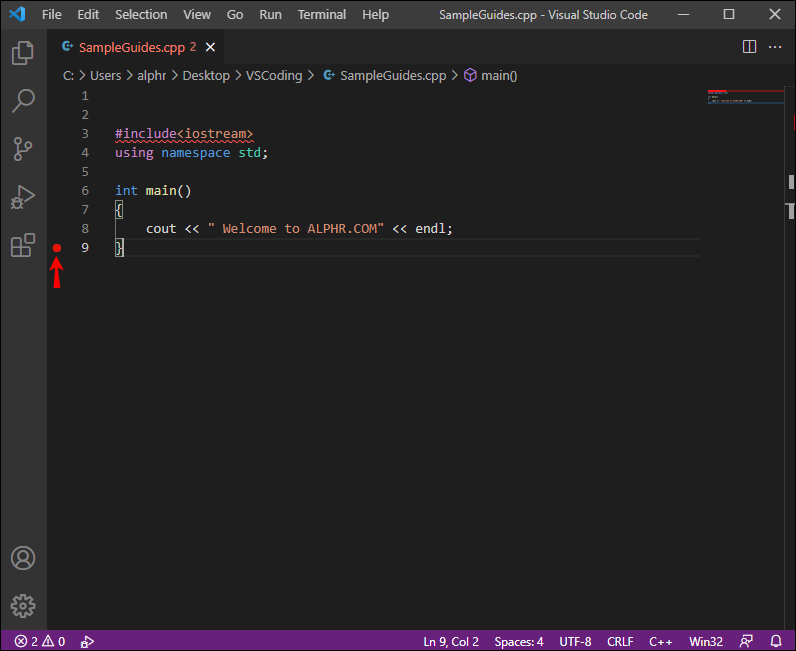
- Click the left margin or strike the F9 key next to the line you wish to stop.

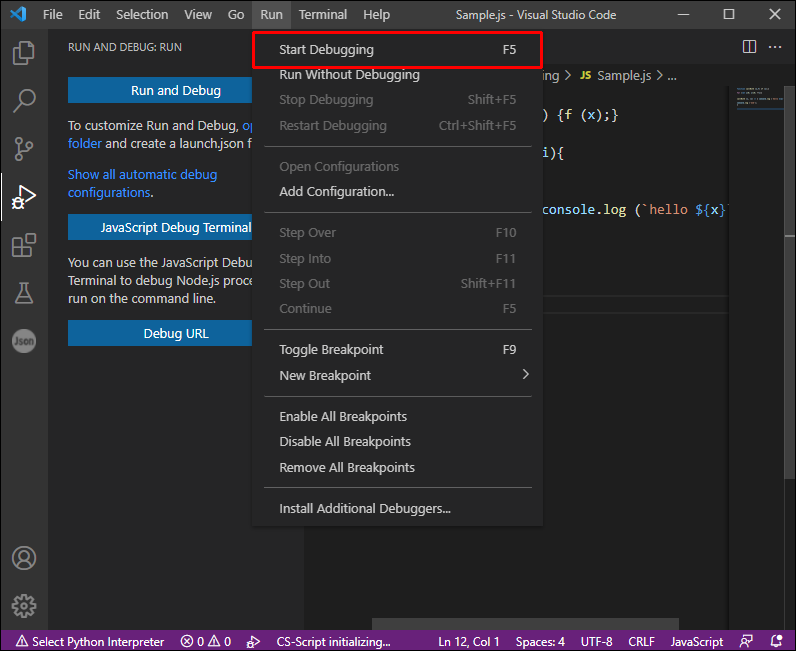
- Run the code or press F5 (“Continue”).

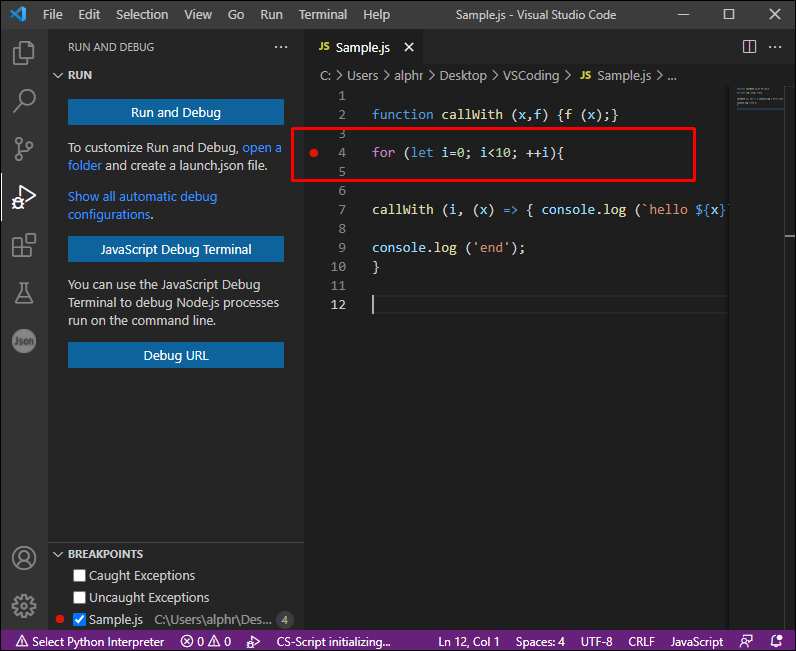
- Your code will now pause before the marked execution. The breakpoint will appear as a red dot inside your left margin.

By default, current execution code lines and breakpoints are automatically highlighted for most programming languages, including C#. If you’re working in C++, you can activate highlighting as follows:
- Navigate to “Debug” or “Tools.”
- Choose “Options,” followed by “Debugging.”
- Select the following command: “
Highlight entire source line for current statement and breakpoint.”

Once the debugger pauses at your breakpoints, you can inspect the current condition of your app. The data you can view includes call stacks and variable values.
When it comes to the color, breakpoints are typically colored red if you’re working in your editor margin. Disabled breakpoints are represented by a filled gray circle, whereas a gray hollow circle signals breakpoint that can’t be registered. The latter may also apply if you’re editing the source while your debug sessions without live-editing support are in progress.
Here are a few more notable breakpoints commands:
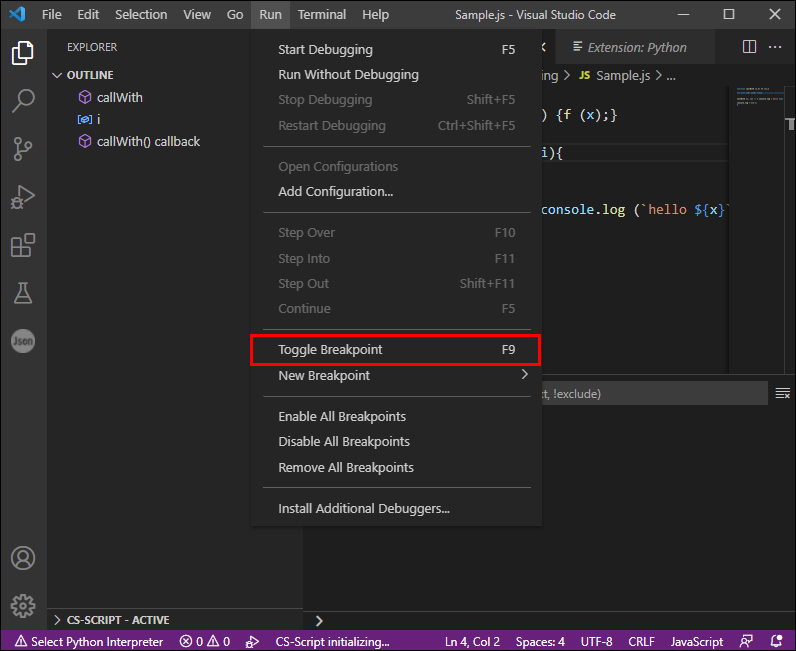
- “Toggle Breakpoint” – Among other things, this command lets you reinsert or delete a breakpoint.
- “Disable Breakpoint” – Disable your breakpoint without deleting it. Such breakpoints are shown as hollow dots in your left margins or your “Breakpoints” window.
- “Enable Breakpoint – This command appears once you hover over a disabled breakpoint and lets you re-activate it.
- “Settings” – The “Settings” section contains numerous commands that let you add, edit, and export your breakpoints. The menu appears once you hover over the breakpoint and press “Settings.”
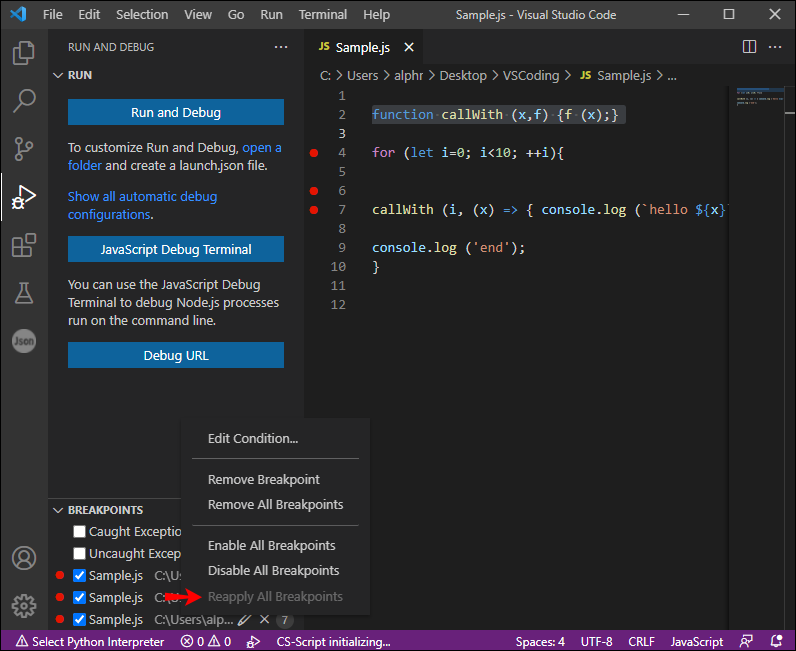
- “Reapply All Breakpoints” – Return all your breakpoints to the original location. This function is handy if the debug environment misplaces breakpoints within source code that haven’t been executed yet.


Additional FAQs
What are logpoints in VS Code?
Logpoints are another useful variant of breakpoints. Instead of breaking into your debugger, they log messages to your console and serve as temporary trace statements in your programming language. In addition, they don’t interrupt code execution.
Logpoints can be an excellent injecting device when you’re debugging a production server that can’t be stopped or paused. They appear as diamond-shaped icons and feature plain text. However, they can also come with expressions evaluated with curly braces.
Like standard breakpoints, logpoints can be activated and deactivated. You can also control them with a hit count or condition.
Plus, while they’re supported by the build-in Node.js debugger, they can be applied through other debugging platforms as well. The list includes Java and Python extensions.
How do I use conditional breakpoints in VS Code?
One of the most powerful VS Code features is the ability to insert conditions according to hit counts, expressions, or combinations of both:
• “Hit Count” – The “Hit Count” function dictates the number of times you need to hit your breakpoint before it breaks code execution. The syntax of this expression and whether the hit count is followed depend on your debugger extension.
• “Expression Condition” – Code will hit this breakpoint whenever your expression shows a “True” evaluation.
You can add hit counts and conditions when creating source breakpoints with your “Add Conditional Breakpoint” option. Alternatively, these features are accessible when modifying existing breakpoints through the “Edit Condition” function. Regardless of the method, you should see a text box and a menu that enables you to enter their expressions. You can also edit conditions using your context menu or the “Edit Condition” window.
Furthermore, VS Code supports hit counts and conditions for “Exception” and “Function” breakpoints. If your debugger isn’t compatible with conditional breakpoints, the “Edit Condition” and “Add Conditional Breakpoint” options won’t be accessible.
What Are Inline Breakpoints in VS Code?
Inline breakpoints are only hit when code execution arrives at the column connected to your inline breakpoint. They are especially helpful when debugging minified code that contains several statements in one line.
To set inline breakpoints, you can use the “Shift + F9” key combination. Another option is to access the “Context” menu while you’re in a debugging session. They’ll be shown within the editing window.
The “Context” menu also lets you edit multiple breakpoints in a single line.
What Are Function Breakpoints in VS Code?
Rather than placing a breakpoint directly in your source code, you can create one by designating a function name. This feature works great for unavailable sources with a familiar function name.
Here’s how to create a function breakpoint:
1. Hit the “+” symbol in your “Breakpoints” header.
2. Enter a function name.
3. This will create a function breakpoint, and it’ll be represented with a red triangle.
What Are Data Breakpoints in VS Code?
Some debuggers also support data breakpoints. They can be activated through the “Variables” window and are hit when the variable value changes. The breakpoints appear as red hexagons inside the “Breakpoints” menu.
Gateway to Numerous Possibilities
Breakpoints in VS Code can be used in many different ways, opening the door for nearly endless possibilities when debugging your code. With all the types of breakpoints we’ve covered above at your disposal, you’ll easily observe the behavior of your lines and facilitate the debugging process. Best of all, most of them can be quickly activated, and each of them is clearly represented to expedite your coding efforts further.
Have you tried using breakpoints in VS Code? What type of breakpoint do you use most often? Have you ever activated an Object ID? Let us know in the comments section below.
Disclaimer: Some pages on this site may include an affiliate link. This does not effect our editorial in any way.