Confidence Interval is a common statistics metric that determines how far a Sample Mean is from the actual Population Mean. If you have a wide set of sample values, calculating the Confidence Interval manually can get very complicated. Thankfully, Google Sheets allows you to find the CI value promptly – and we’re here to show you how to do that.
In this guide, we’ll explain how to calculate Confidence Interval in Google Sheets. We’ll also provide answers to some of the most common questions related to the Confidence Interval calculation and use.
How to Calculate Confidence Interval in Google Sheets
Calculating the Confidence Interval in Google Sheets is quite simple even if you have a lot of samples. To do that, follow the instructions below:
- In Google Sheets, enter all of your samples and their values.
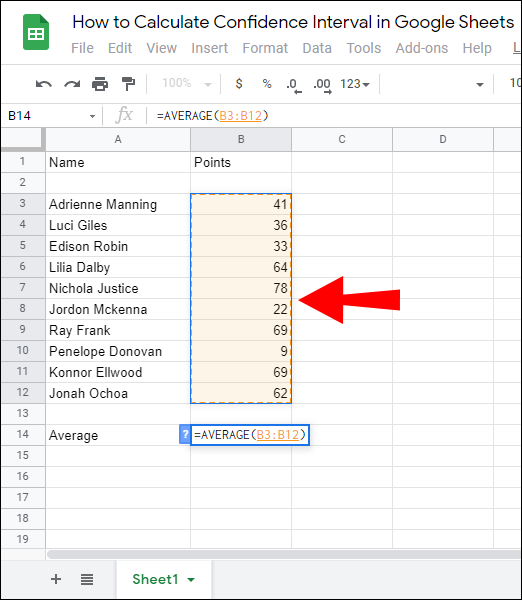
- Under your sample column, enter the Average formula – =AVERAGE(value set).
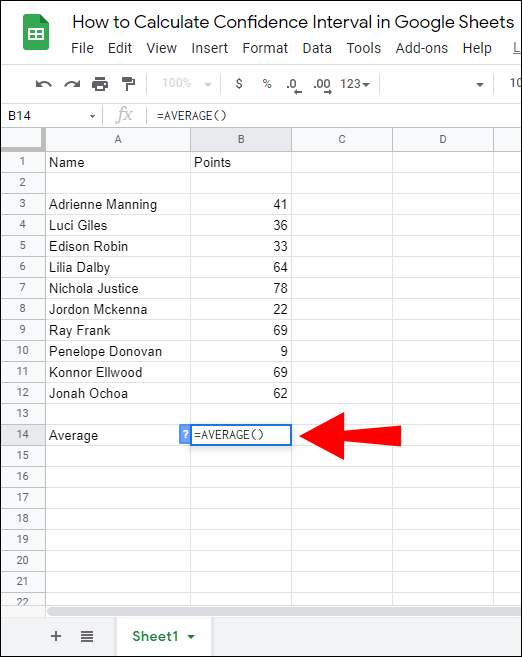
- In the “values” field, select all of your sample values by highlighting them, then hit the ‘’Enter’’ key to calculate the Average.

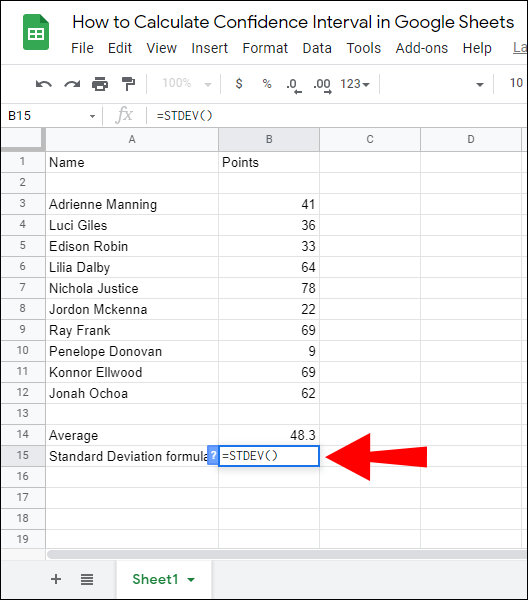
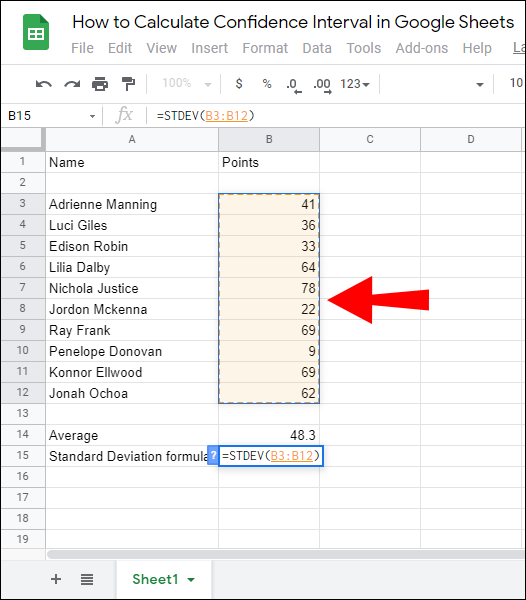
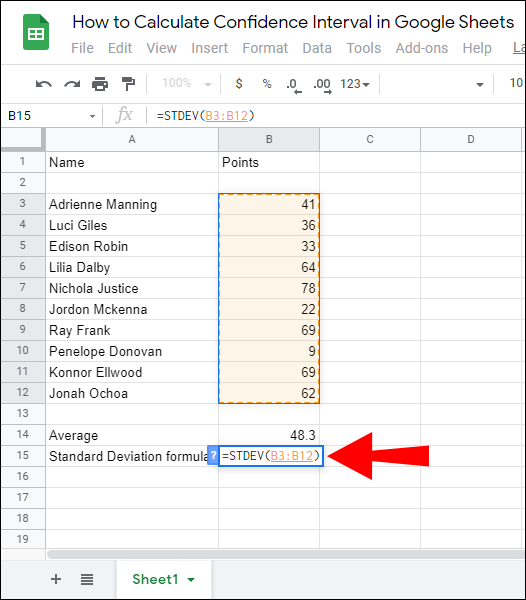
- Under the Average, enter the Standard Deviation formula – =STDEV(value set).
- In the “values” field, select all of your sample values by highlighting them, then hit the ‘’Enter’’ key to calculate the Standard Deviation.
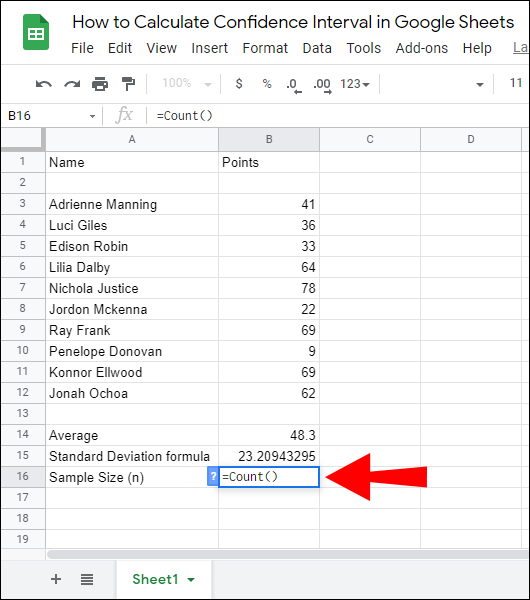
- Under the Standard Deviation, enter the Sample Size (n) formula – =COUNT(values).
- In the “values” field, select all of your sample values by highlighting them, then hit the ‘’Enter’’ key to calculate the sample number. If you don’t have many samples, you can count them manually.
- Under the Sample Size, enter the Confidence Interval formula – =TINV(1-.(Confidence Interval percentage), n(Sample Size)-1)*STDEV/SQRT(n).
- Enter your Standard Deviation and Sample Size values by highlighting them or manually and hit the ‘’Enter’’ button to calculate the Confidence Interval.

How to Find 95% Confidence Interval in Google Sheets
If you need to calculate a 95% Confidence Interval in Google Sheets, follow the guide below:
- In Google Sheets, enter all of your samples and their values.
- Under your sample column, enter the Average formula – =AVERAGE(value set).
- In the “values” field, select all of your sample values by highlighting them, then hit the ‘’Enter’’ key to calculate the Average.
- Under the Average, enter the Standard Deviation formula – =STDEV(value set).
- In the “values” field, select all of your sample values by highlighting them, then hit the ‘’Enter’’ key to calculate the Standard Deviation.
- Under the Standard Deviation, enter the Sample Size (n) formula – =COUNT(values).
- In the “values” field, select all of your sample values by highlighting them, then hit the ‘’Enter’’ key to calculate the sample number. If you don’t have many samples, you can count them manually.
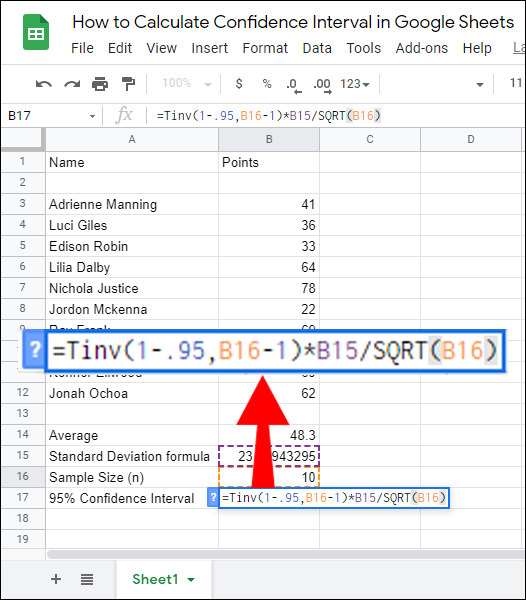
- Under the Sample Size, enter the 95% Confidence Interval formula – =TINV(1-.95, n(Sample Size)-1)*STDEV/SQRT(n).
- Enter your Standard Deviation and Sample Size values by highlighting them or manually and hit the ‘’Enter’’ button to calculate the 95% Confidence Interval.
Frequently Asked Questions
In this section, we’ll provide answers to some of the most common questions related to Confidence Interval calculation and use.
How Do I Calculate 95% Confidence Interval?
Confidence Interval is calculated using the CI = Sample Mean (x) +/- Confidence Level Value (Z) * (Sample Standard Deviation (S) / Sample Size (n)) formula. The Critical Value for a 95% Confidence Interval is 1.96, therefore, you should insert 1.96 in the formula in place of the ‘’Z.’’
If you’re calculating a 95% Confidence Interval in Google Sheets, calculate the sample value Average, Standard Deviation, and Sample Size first, then, enter the values to the following formula: =TINV(1-.95, n(Sample Size)-1)*STDEV/SQRT(n), and hit the ‘’Enter’’ key.
What Is the Z* for a 90% Confidence Interval?
The Z for a 90% Confidence Interval is 1.645. Even though the Z values for specific Confidence Interval percentages are always the same, you don’t necessarily have to memorize all of them. Instead, remember the formula for finding the Z score – Mean (x) +/- Z value * (Standard Deviation (S) / √Number of Observations (n)).
How Is Confidence Interval Calculated?
If you’re calculating the Confidence Interval manually, use the CI = Sample Mean (x) +/- Confidence Level Value (Z) * (Sample Standard Deviation (S) / Sample Size (n)) formula. To find the Sample Mean, add all the sample values together and divide them by the number of samples.
The Z value can be found using the Mean (x) +/- Z value * (Standard Deviation (S) / √Number of Observations (n)) formula or simply by checking it in the Z value table.
To find the Standard Deviation, insert values in the √ (Summ of ((Each value from the population – Population mean) * (Each value from the population – Population mean)) / The size of population). The ‘’n’’ value is simply the number of your samples. Google Sheets calculates the Confidence Interval easier and faster.
Type in your samples and their values to a spreadsheet and use the =TINV(1-.95, n(Sample Size)-1)*STDEV/SQRT(n) formula.
How Do I Find the Z Score in Google Sheets?
The Z score is calculated in Google Sheets using the = (DataValue – Mean) / Standard Deviation formula. Therefore, you have to find the Mean and Standard Deviation first.
To find the Mean, use the =AVERAGE(value set) formula and enter all of your values by highlighting them. The Standard Deviation can be found by typing in the =STDEV(value set) formula.
Another way to quickly find the Z score is to check the Z score table or memorize them, as they always remain the same. The Z score for a 90% Confidence Interval is 1.645, for 95% – 1.96, and for 99% – 2.576.
What Is the Sample Size of Confidence Interval?
The Sample Size of a Confidence Interval is the total number of your samples. For example, if you have a table consisting of 25 samples and their values, the Sample Size is 25. In Google Sheets, you can calculate the Sample Size by entering the =SUM(value set) formula and highlighting all of your samples.
What Is a Confidence Interval?
Confidence Intervals are used to determine how far the Sample Mean is from an actual Population Mean. In other words, it displays the error interval between these two means, or the upper and lower error limit around the sample mean.
For example, if you calculate a 90% Confidence Interval, you can be 90% sure that the Population Mean lies in your Sample Mean interval. Most often, 95% and 99% Confidence Intervals are used, as they allow to calculate the lowest error percentage. However, sometimes 80%, 85%, and 90% Confidence Intervals are applied.
How Do I Create a Graph in Google Sheets?
To create a graph in Google Sheets, select required value cells. Then, click “Insert” at the upper part of your screen. Select “Chart” from the dropdown menu, then pick the kind of your chart or graph. To open additional customization options, click “Customization.”
Finally, click “Insert,” drag and move the chart to the desired place in your spreadsheet. To make a visual representation of your Confidence Interval data, you can create a chart of all the sample values and their Mean, and mark the Confidence Intervals on the chart.
Calculate With Ease
Google Sheets is a highly useful tool for statistical metric calculation – it helps to notably speed up and simplify the process. Hopefully, with the help of our guide, you can now easily find a Confidence Interval for any sample value set. If you’re going to present the data to non-professionals, we advise creating a graph to make your Confidence Interval information more comprehensible. Thankfully, Google Sheets lets you do this in a couple of clicks.
Do you prefer using Google Sheets or Excel? Why? Share your opinions in the comments sections below.
Disclaimer: Some pages on this site may include an affiliate link. This does not effect our editorial in any way.