When you need to calculate the percent change between two numbers, Excel is a handy tool to use.
This article will show you how to calculate percent change in excel. You can use this calculation to compare two values and see how much they have changed. We will also provide a few examples to help you understand how to use the calculation. Let’s get started!
Calculating Percent Change in Excel
Percent change measures how much one value has changed in relation to another. In other words, it’s a way to track progress and see how different values compare.
This function is handy when tracking data over time. For example, if you want to track the sales percent change between two years, you can simply enter the sales figures for each year into two separate cells and then use the percent change function to calculate the difference.
This can help you to spot trends and make better decisions about your business.
There are a few different ways to calculate the percent change in Excel, but the most straightforward method involves using the Percent Change function. This function takes two arguments: the first is the old value, and the second is the new value.
To use the function, enter the old value in one cell and the new value in another. Then, select the cell where you want the result and enter “= PERCENTCHANGE(old value, new value)” – for example, “= PERCENTCHANGE(A1, A2)“. The function will then calculate the percentage change and display it in the selected cell.
Here’s another example:
If you wanted to calculate the percent change from 10 to 15, you would use the following formula:
=PERCENTCHANGE(10,15).
This would return a result of 50%, indicating that the new value is 50% higher than the old value.
You can also use the Percent Change function to calculate percent change over time. To do this, you need to have a column of data containing sequential values (such as monthly sales figures). Then, you could use the PERCENTCHANGE function to calculate the percent change between each month. For example, if your data looked like this:
January: 100
February: 110
March: 120
You could use the following formula to calculate the percent change between January and February: =PERCENTCHANGE(100,110)
This would return a result of 10%, indicating that February’s sales were 10% higher than January’s. You could then repeat this process for February-March, March-April, and so on.
Calculate Percentage Change Excel VBA
Excel VBA (Visual Basic for Applications) is a powerful tool that can help you automate repetitive tasks and streamline workflows. VBA stands for Visual Basic for Applications, a programming language that allows you to control Excel using code.
With Excel VBA, you can create macros or small programs that can automate tasks such as inserting data, formatting cells, or performing calculations. You can also use Excel VBA to develop custom applications that can be used within Excel.
If you need to track percentage changes on a regular basis, you can automate the process by creating a simple macro in VBA. To do this, open the Visual Basic Editor (in Excel, select “Developer” > “Visual Basic” from the ribbon) and enter the following code:
Sub PercentChange()
Dim oldValue As Double Dim newValue As Double oldValue = Range("A1").Value ‘replace with cell containing old value newValue = Range("A2").Value 'replace with cell containing new valueRange("A3").Value = PercentageChange(oldValue, newValue) ‘result will be displayed in cell A3End Sub
This macro will take two numbers from cells A1 and A2 and calculate the percent change in cell A3. You can then use this cell to reference the percent change between any two numbers in your worksheet. Simply enter the old number in cell A1 and the new number in cell A2, and the macro will calculate the percent change for you.
This can be useful when tracking data over time or comparing two different data sets, saving you time if you need to track changes frequently.
Calculate Percentage Change Excel Pivot Table
A pivot table is a powerful tool in Excel that allows you to organize and summarize data. You can use it to group data, calculate averages or totals, and even create charts.
Pivot tables are especially helpful when you have large amounts of data that you need to slice and dice in different ways. For example, if you have sales data for different products and regions, you can use a pivot table to quickly see which products are selling well in which regions.
Calculating the percentage change in Excel using a pivot table is often the quickest and most accurate method. To begin:
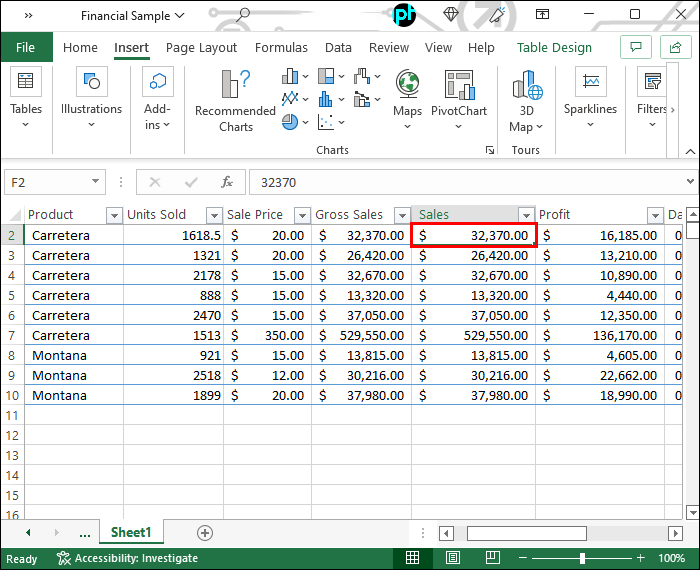
- Select the cells that contain the data you want to include in the pivot table.
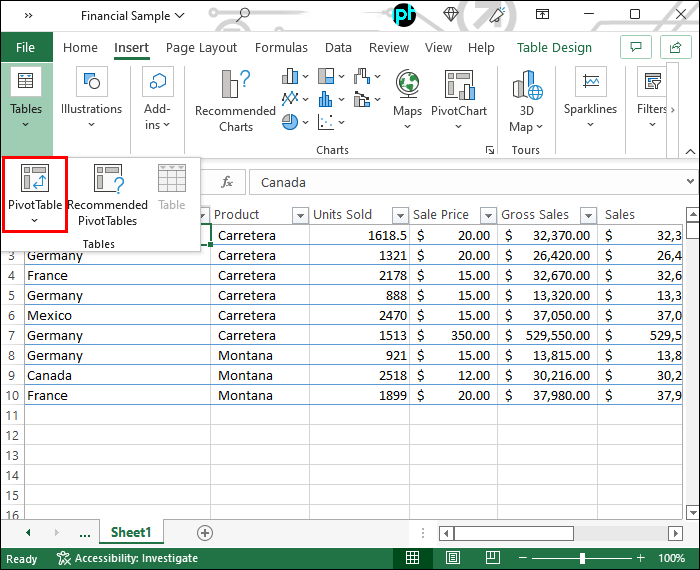
- Click the “Insert” tab and choose “Pivot Table” from the drop-down menu.

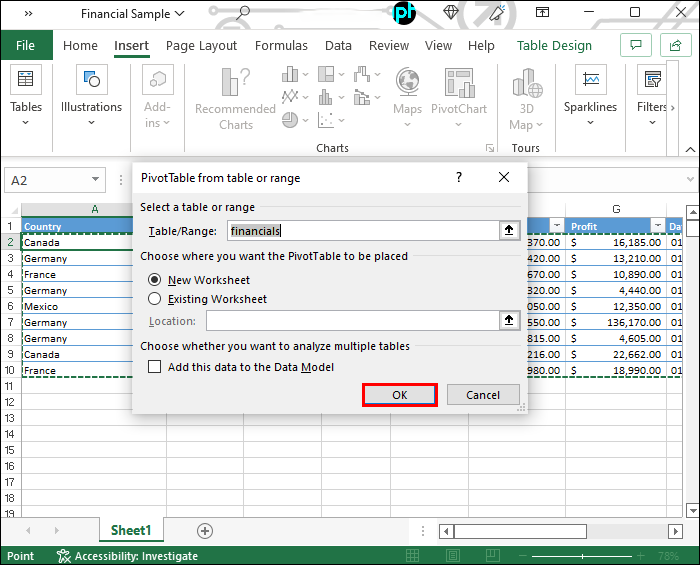
- In the resulting dialog box, make sure that the correct data range is selected and that the “New Worksheet” option is checked. Click OK to continue.
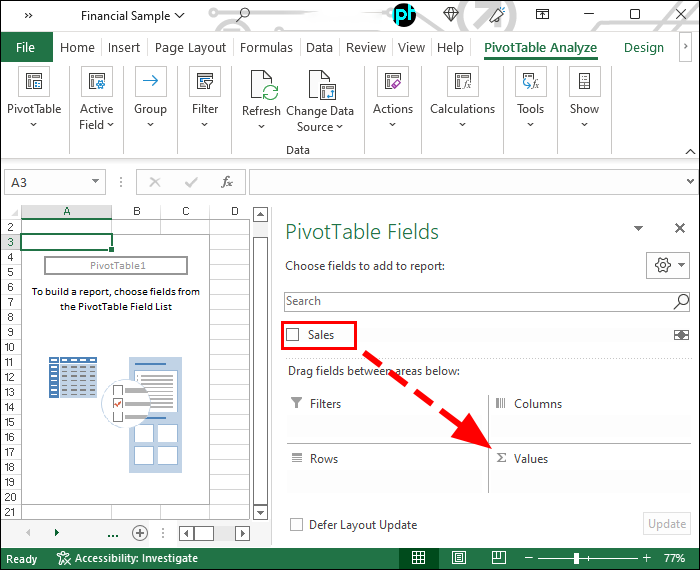
- Drag the field for which you want to calculate percentage change into the “Values” area of the pivot table.
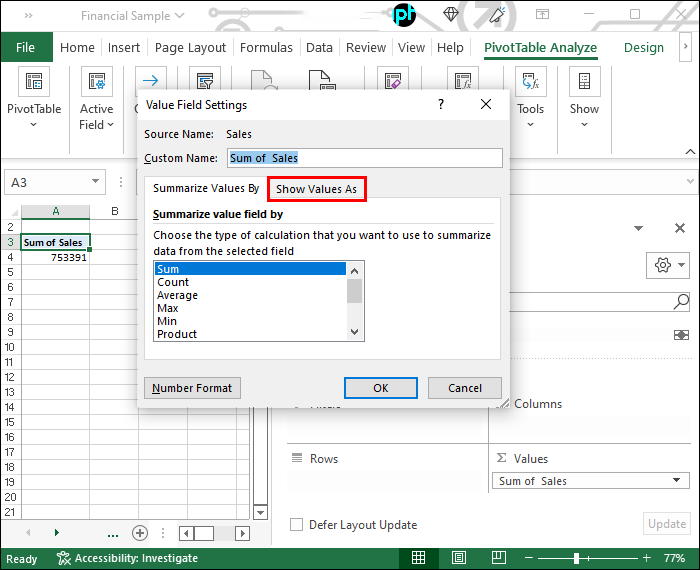
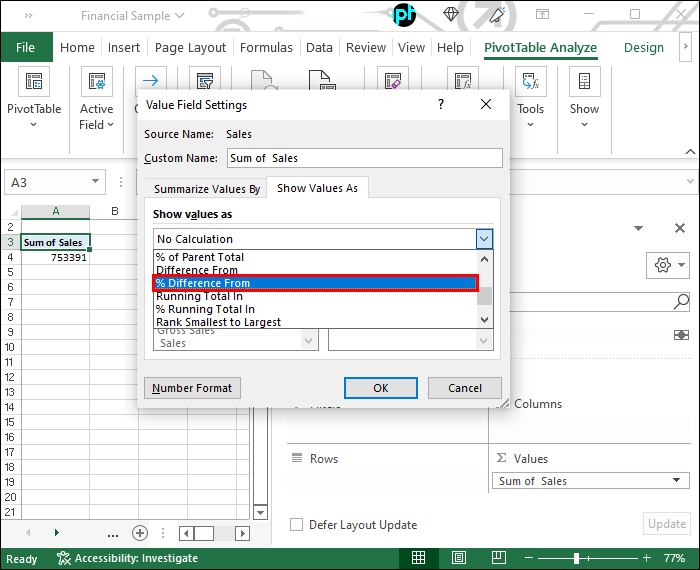
- Choose “Value Field Settings” from the context menu and “Show Values As” from the drop-down menu.
- Select “Percentage Difference From” in the second drop-down menu and click OK to apply your changes. The pivot table will now show percentage changes for the selected field.
This technique can calculate all sorts of percentages, including percent changes in values over time. With a little practice, you’ll be able to use pivot tables to quickly and easily calculate any percentage you need.
Track Changes Efficiently
Percent change is a relatively simple concept that can be useful in various situations. For example, you might want to calculate the percent change in sales from one month to the next, or you might want to compare the percent change in two different stock prices over time.
Excel includes a built-in function for calculating percent change, or you can also use a simple formula. However, if you need to calculate percent change regularly, using a macro or Visual Basic for Applications (VBA) code may be more efficient.
Have you tried calculating the percent change in Excel using the Percent Change formula? If not, give it a try and let us know how it goes!
Disclaimer: Some pages on this site may include an affiliate link. This does not effect our editorial in any way.